connattractor
for Connectivity-based Hopfield Neural Networks (CHNNs)
Installation
pip install connattractorQuickStart Guide
Contents
Part 1: The quickest way to plot and analyze your data on the CHNN projection
Part 2: Build your own CHNN projection
Imports
import sys
sys.path.append('..')
import pickle
import pandas as pd
import numpy as np
import seaborn as sns
import matplotlib.pyplot as plt
from connattractor import network, analysis, utils
Part 1: The quickest way to plot and analyze your data on the CHNN projection
For the quickest start, you can load the pre-computed embedding, calculated on the example connectome provided with the package.
hopfield_embedding = utils.get_fcHNN_template_embedding()Load the example task data (scrubbed and seperated into task and rest)
rest, sub_rest, task, sub_task = utils.get_ex_task_data()perc. scrubbed: 0.8133971291866029
perc. scrubbed: 0.5741626794258373
perc. scrubbed: 0.6267942583732058
perc. scrubbed: 0.7081339712918661
((405, 122), (1052, 122), array([42.3, 43.3, 44.3, 45.3, 46. , 46.3]), 405)Plot the data in the projection plane
To get a good impression on the data in the projection, we first plot a contourplot of all activations of the rest data and plot the mean activations during rest of all study participants on the projection. We repeat the same for the task data.
fig, ax = plt.subplots(1, 2, subplot_kw={'projection': 'polar'}, figsize=(8, 4))

hopfield_embedding.plot(rest, plot_type='contourf', ax=ax[0],
                    density_bins=30, density_sigma=1, levels=6, alpha=0.8, cmap='Blues',
                    attractor_plot_type='glassbrain', attractor_kwargs=dict(cmap='binary'),
                    regimes_fill_kwargs=dict(alpha=0.0),
                    regimes_contour_kwargs=dict(alpha=1.0, colors='black')
                   )

sub_means_rest = np.array([np.mean(rest[sub_rest==sub], axis=0) for sub in np.unique(sub_rest)])
sub_means_task = np.array([np.mean(task[sub_task==sub], axis=0) for sub in np.unique(sub_task)])

hopfield_embedding.plot(sub_means_rest, plot_type='scatter', ax=ax[0],
                        marker='^', c='black', s=30,
                        attractor_plot_type='scatter', attractor_kwargs=dict(alpha=0),
                        regimes_fill_kwargs=dict(alpha=0.0),
                        regimes_contour_kwargs=dict(alpha=1.0, colors='black')
                       )
ax[0].set_yticks([])
ax[0].grid(False)


hopfield_embedding.plot(task, plot_type='contourf', ax=ax[1],
                    density_bins=30, density_sigma=1, levels=6, alpha=0.8, cmap='Reds',
                    attractor_plot_type='glassbrain', attractor_kwargs=dict(cmap='binary'),
                    regimes_fill_kwargs=dict(alpha=0.0),
                    regimes_contour_kwargs=dict(alpha=1.0, colors='black')
                   )

hopfield_embedding.plot(sub_means_task, plot_type='scatter', ax=ax[1],
                        marker='^', c='black', s=30,
                        attractor_plot_type='scatter', attractor_kwargs=dict(alpha=0),
                        regimes_fill_kwargs=dict(alpha=0.0),
                        regimes_contour_kwargs=dict(alpha=1.0, colors='black')
                       )


ax[1].set_yticks([])
ax[1].grid(False)
plt.show()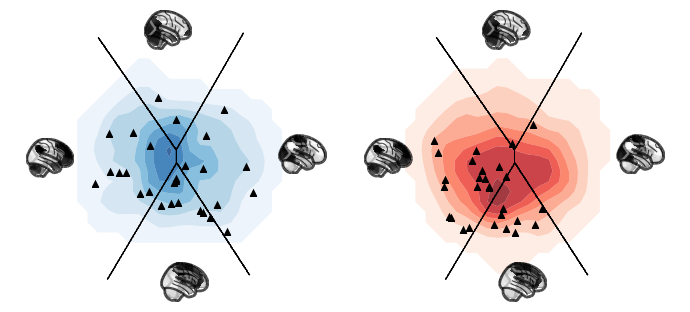
Statistical analysis
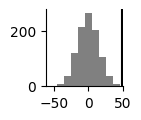
To compare the two conditions statistically with a permutation test, compare the position difference in the projection plane as well as the absolute energy difference as test statistics. In this example we calculate 1000 permutations, swapping the conditions and plot the actual difference against the null distribution.
from numpy.linalg import norm
random = np.random.default_rng(42)
noise = 0.37
num_perm = 1000


sub_means_rest = np.array([np.mean(rest[sub_rest==sub], axis=0) for sub in np.unique(sub_rest)])
sub_means_task = np.array([np.mean(task[sub_task==sub], axis=0) for sub in np.unique(sub_task)])

task_embedded = hopfield_embedding.embedding_model.transform(sub_means_task)[:, :2]
rest_embedded = hopfield_embedding.embedding_model.transform(sub_means_rest)[:, :2]
diffs = task_embedded - rest_embedded
true_diffs_norm = np.array([norm(d) for d in diffs])
true_diff_mean = np.mean(true_diffs_norm)

energy_rest = np.array([hopfield_embedding.hopnet.energy(s) for s in sub_means_rest])
energy_task = np.array([hopfield_embedding.hopnet.energy(s) for s in sub_means_task])

true_energy_diff = energy_rest - energy_task
true_energy_diff_mean = np.mean(true_energy_diff)

n = len(diffs)
diffs = []
energy_diffs = []

for p in range(num_perm):
    # swap conditions randomly (i.e. sign flip)

    perm_i = random.choice([1,-1], n)
    diffs.append(np.mean(true_diffs_norm * perm_i))
    energy_diffs.append(np.mean(true_energy_diff * perm_i))


plt.figure(figsize=(1,1))
plt.hist(diffs, color='gray')
plt.axvline(true_diff_mean, color='black')

plt.gca().spines['right'].set_visible(False)
plt.gca().spines['top'].set_visible(False)
plt.show()

plt.figure(figsize=(1,1))
plt.hist(energy_diffs, color='gray')
plt.axvline(true_energy_diff_mean, color='black')

plt.gca().spines['right'].set_visible(False)
plt.gca().spines['top'].set_visible(False)
plt.show()


print('p(projection) =', (diffs>true_diff_mean).sum()/num_perm)
print('p(energy) =', (energy_diffs>true_energy_diff_mean).sum()/num_perm)
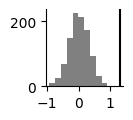
p(projection) = 0.0
p(energy) = 0.0
Part 2: Build your own CHNN projection
Obtain functional connectivity matrix
Should be a partial correlation matrix, square and symmetric.
Below, we load in an example connectome, derived from study 1 of the manuscript. Given the high replicability and generalizability of CHNN analyses, the connectome does not have to stem from the analyzed dataset. Similarly to anatomical standrad templates in neuroimaging practice, the supplied example connectome can be considered a standard connectome template.
Users are, nevertheless, encouraged to use dataset-specific connectomes.
Let’s load in the example connectome
mtx = utils.get_ex_connectome()
mtxConstruct your fcHNN
hopnet = network.Hopfield(mtx)
hopnet.plot_weights()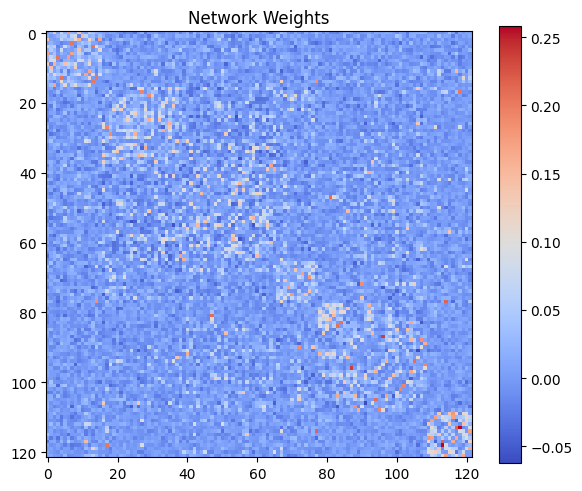
Run the stochastic relaxation procedure to obtain simulated states
It may take a few seconds...
chnn_state_space = analysis.simulate_activations(mtx.values,
                                            noise_coef=0.37,
                                            num_iter=100000,
                                            beta=0.04,
                                            random_state=42)
100%|████████████████████████████████████████████████████████████████████████████████████████████████████████████████████████████████████████████████████████████████████████████████████| 100000/100000 [00:21<00:00, 4619.54it/s]
Create your Hopfield Embedding
Again, a few seconds...
chnn_projection = analysis.create_embeddings(chnn_state_space,
                                             attractor_sample=1000,
                                             random_state=42)
100%|██████████████████████████████████████████████████████████████████████████████████████████████████████████████████████████████████████████████████████████████████████████████████████████| 1000/1000 [00:59<00:00, 16.92it/s]
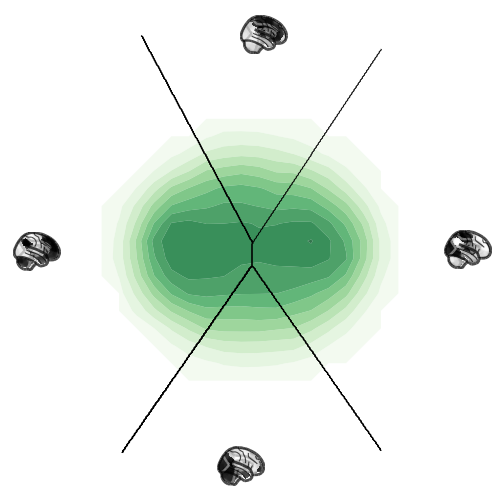
Plot the state space
ax = chnn_projection.plot(chnn_state_space.states, plot_type='contourf',
                          density_bins=30, density_sigma=0.5, levels=12, alpha=0.8, cmap='Greens',
                          attractor_plot_type='glassbrain', attractor_kwargs=dict(cmap='binary'),
                          regimes_fill_kwargs=dict(alpha=0.0),
                          regimes_contour_kwargs=dict(alpha=1.0, colors='black')
                         )
ax.set_yticks([])
ax.grid(False)