Analysis Code: Reconstruction of the Attractor Landscape
- for reconstructing the attractor landscape based on resting state fMRI data -
import numpy as np
import seaborn as sns
from matplotlib import pyplot as plt
import scipy.integrate as integrate

sns.set(style="white")
import os
from glob import glob
import pandas as pd
from sklearn.preprocessing import StandardScaler
Load regional BOLD fMRI timeseries data
See {cite:p}‘Englert et al. (2023)’ for details. For replicating the results on a different dataset, change ‘essen-.tsv’ to 'bochum-.tsv’
# load Essen timeseries data and scrub resting state data
_fd_thr = 0.15
_perc_scrub_thr = 0.5
all_ts = []
root_dir = 'data/ex_timeseries/'
for f in glob(root_dir + 'essen-*.tsv'):  # change to bochum-*.tsv for replication with the Bochum dataset
    path, filename = os.path.split(f)
    ts = pd.read_csv(f, sep='\t').iloc[:, 1:].values
    ts = StandardScaler().fit_transform(ts)
    fd = pd.read_csv(path + '/FD_' + os.path.splitext(filename)[0] + '.txt', sep=',').values.flatten()
    fd = np.hstack(([0], fd))
    if np.sum(fd>_fd_thr)/len(fd) < _perc_scrub_thr:
        all_ts.append(ts[fd<_fd_thr])
    else:
        print('perc. scrubbed:', np.sum(fd>_fd_thr)/len(fd))
len(all_ts)
perc. scrubbed: 0.5103448275862069
perc. scrubbed: 0.503448275862069
47Reconstructing attractors: computational approach
We use the connattractor package Englert et al., 2023 to constrcut a functional connectome-based continuous-space Hopfield network (fcHNN) and identify its attractors by relaxong the network with randomly sampled input states. Unlike for the analytical approach, here we have to set all biases to zero.
from connattractor import network
from nilearn.connectome import ConnectivityMeasure
# fcHNN solution
correlation_measure = ConnectivityMeasure(kind='partial correlation',  vectorize=False, discard_diagonal=False) # uses Ledoit-Wolf estimator
correlation_measure.fit_transform(all_ts)
parcor = 1 * correlation_measure.mean_
hopnet = network.Hopfield(parcor, scale=True)
#hopnet.W = (parcor-np.mean(parcor))/np.std(parcor) # overwrite the weights to put back the diagonal
attractors = {}
rng = np.random.default_rng(42)
for i in range(100):
    res = hopnet.update(np.tanh(rng.normal(0,1,122)), threshold=0, beta=0.065, num_iter=100000) # 0.0625 -> 10
    if res[1]<100000: # converged
        state = tuple(np.round(res[0], 1))
        if state not in attractors.keys():
            attractors[state] = 1
        else:
            attractors[state] += 1
    else:
        print('.')

attractors_fchnn = sorted(attractors.items(), key=lambda item: item[1])[::-1]
len(attractors_fchnn)17Plot the attractros
attractor_states_fchnn = np.array([k for i, (k, v) in enumerate(attractors_fchnn)])
for i in range(attractor_states_fchnn.shape[0]):
    network.State(attractor_states_fchnn[i]).plot()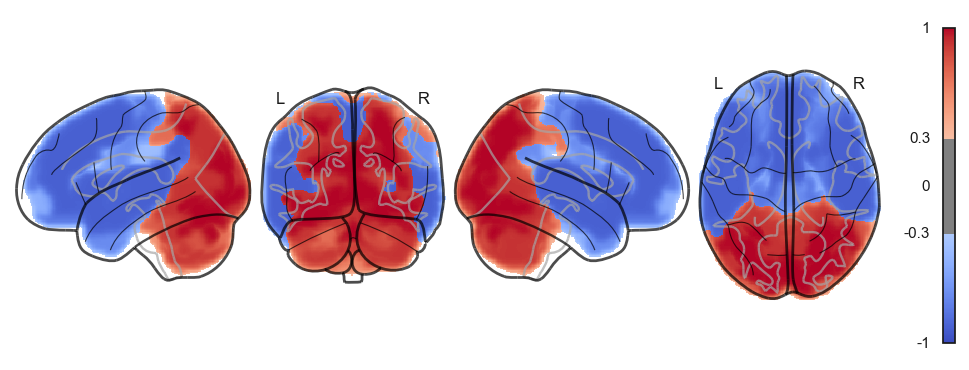
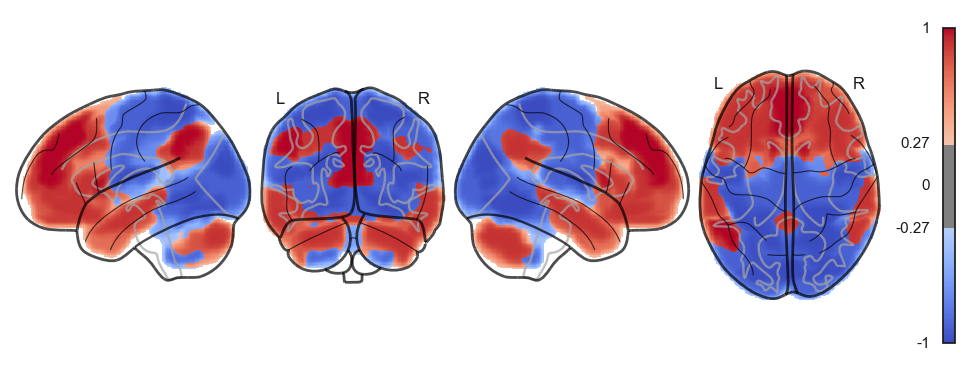
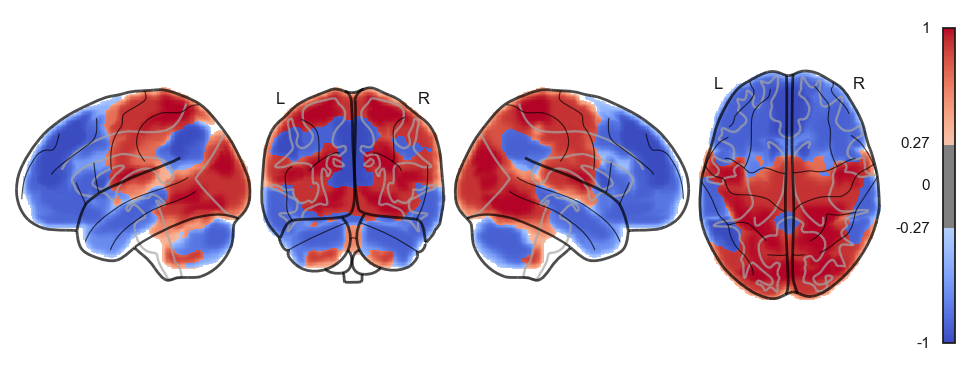
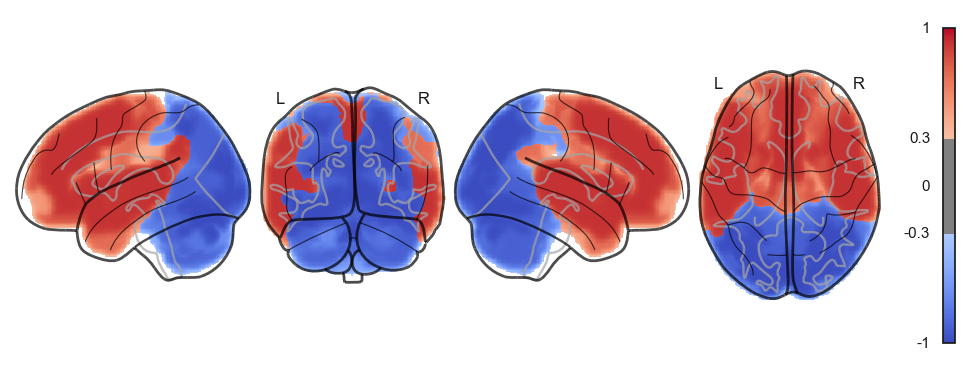
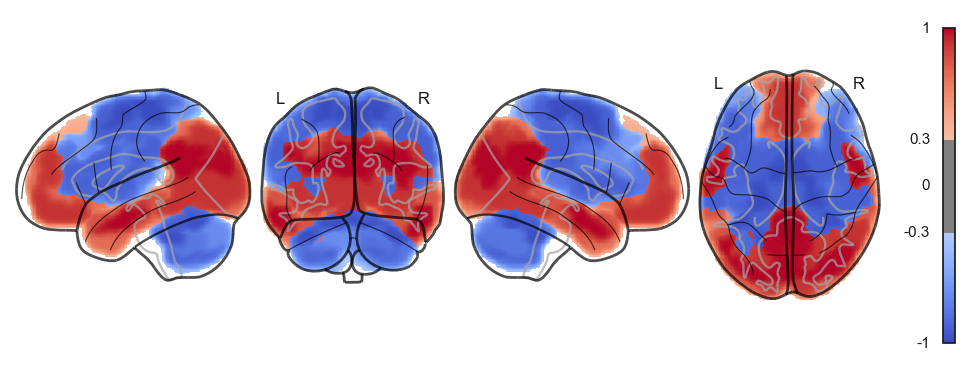
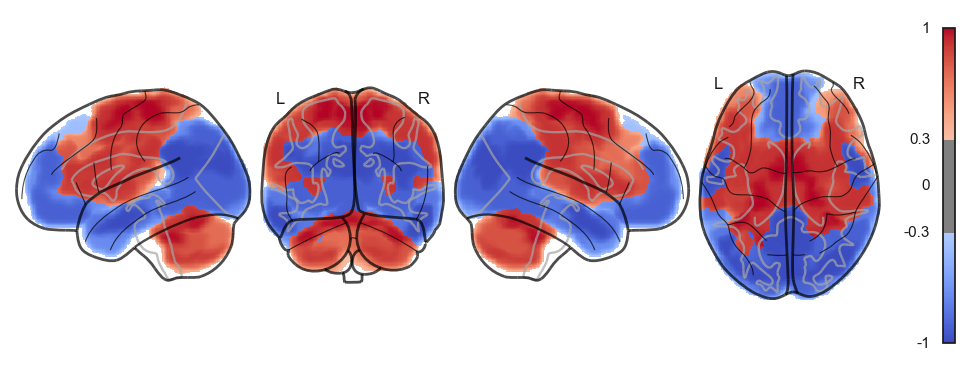
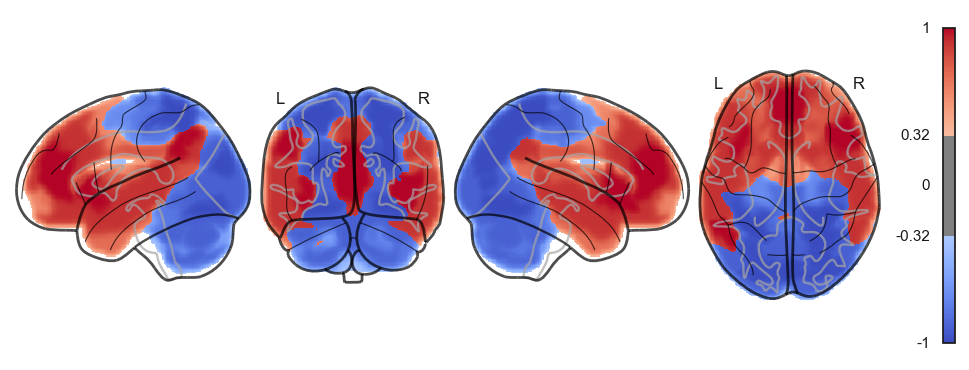
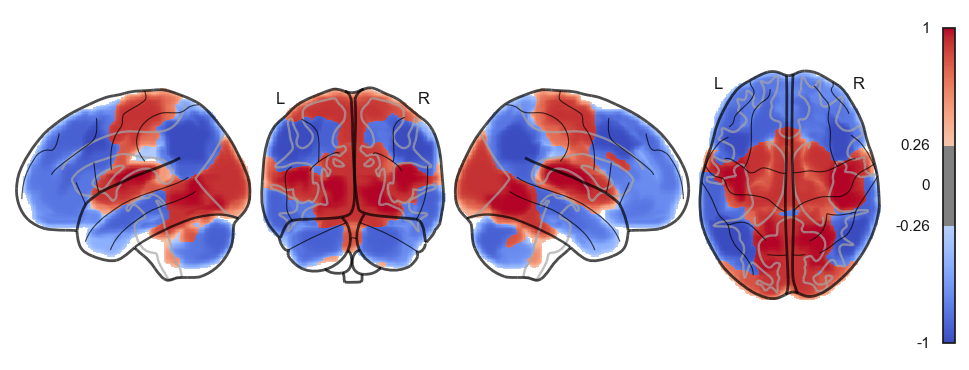
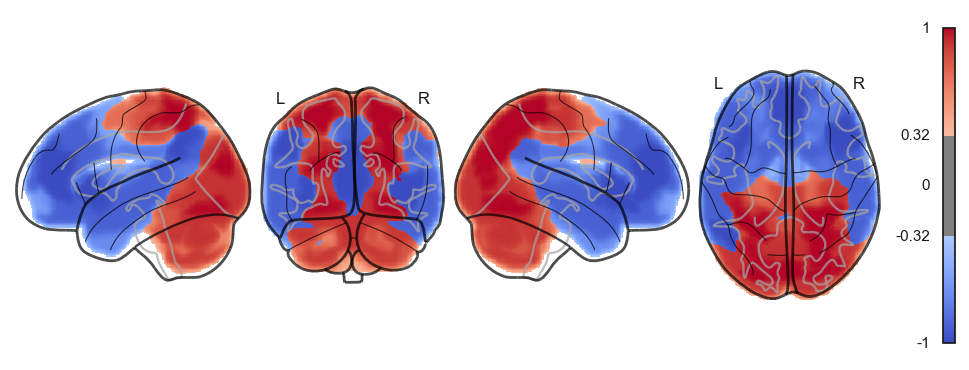
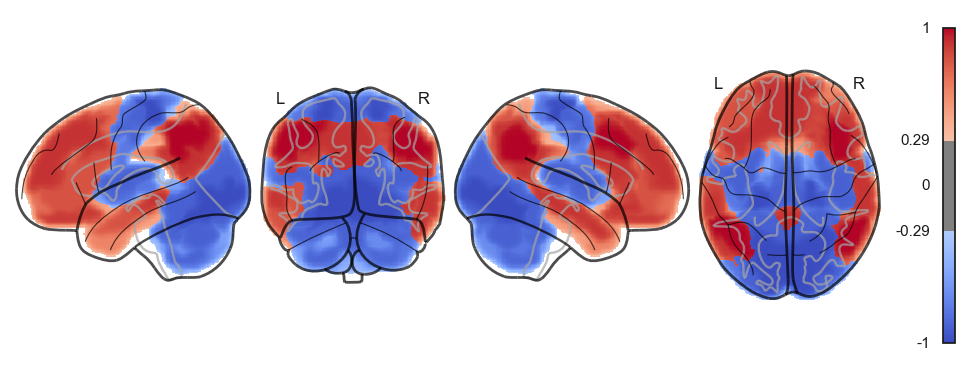
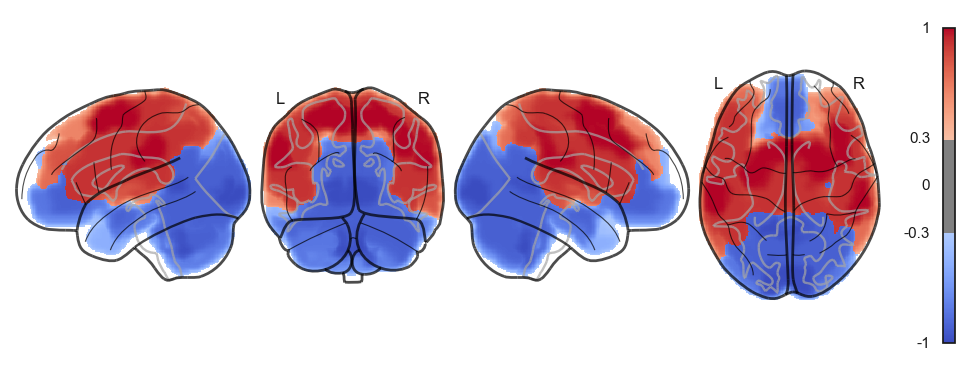
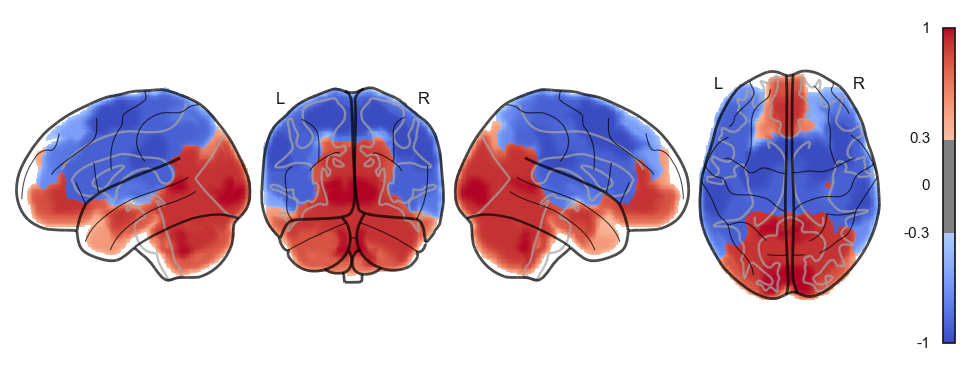
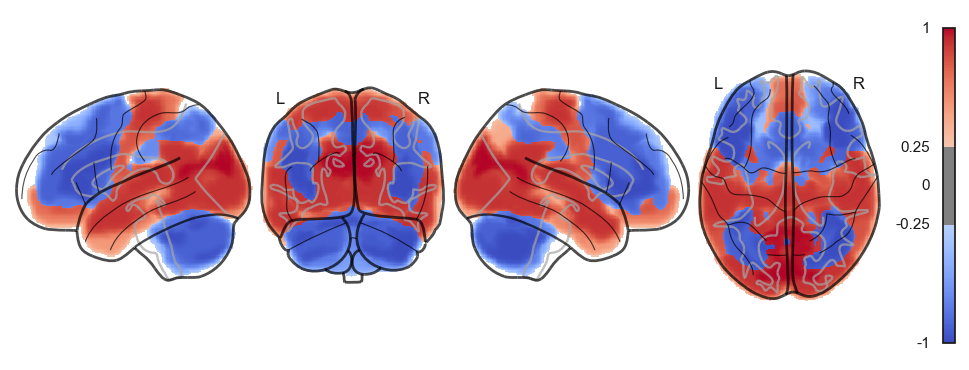
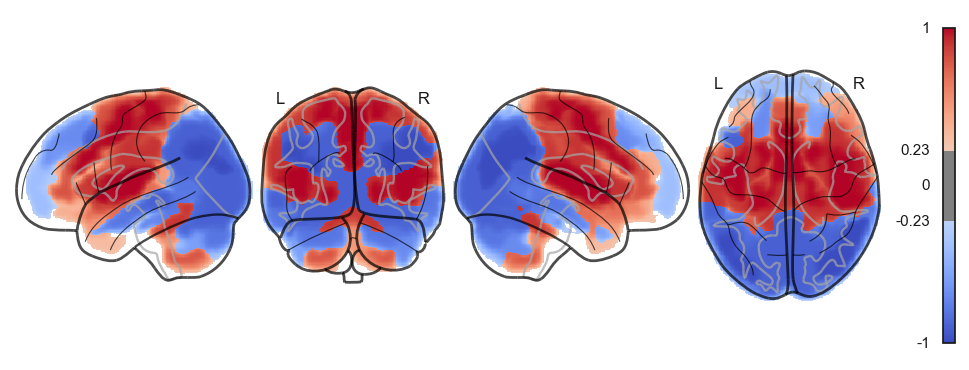
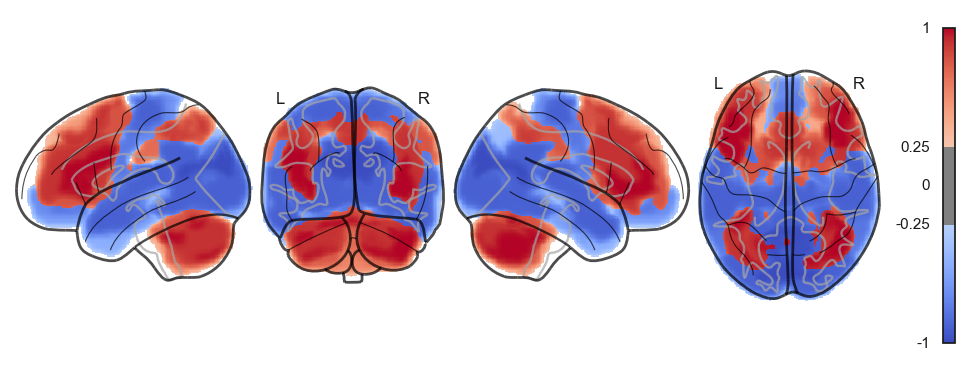
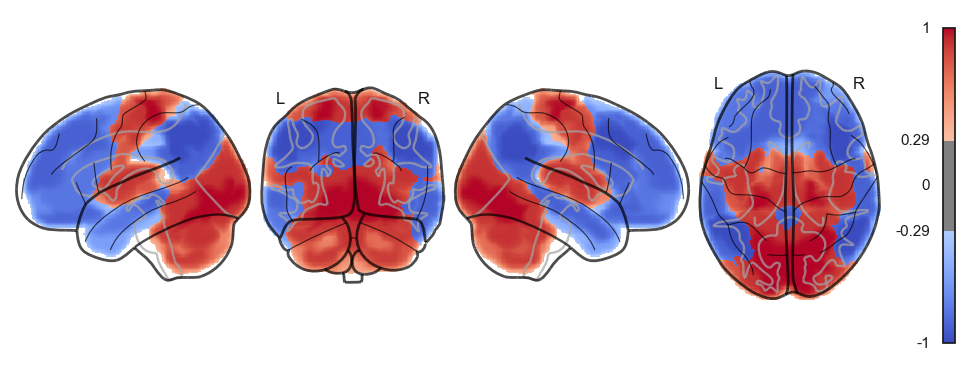
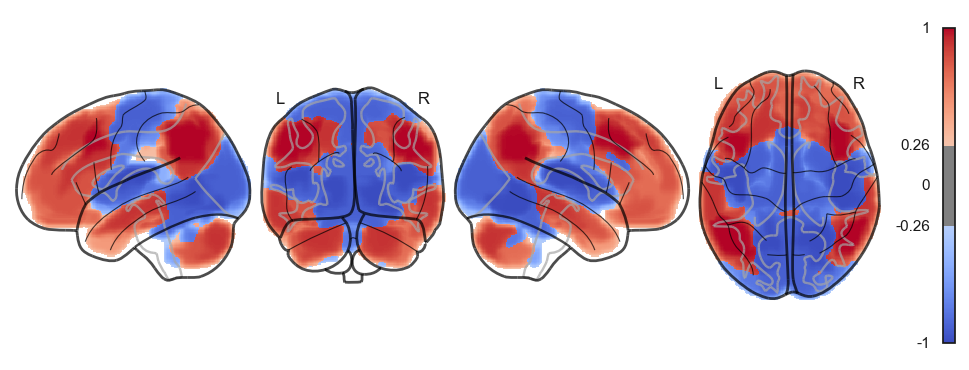
Attractor frequencies
for i, (k, v) in enumerate(attractors_fchnn):
    print(i, v)
0 1909
1 1820
2 1077
3 1035
4 781
5 709
6 513
7 470
8 404
9 400
10 230
11 198
12 100
13 90
14 89
15 82
16 46
17 41
18 3
19 3
Reconstructing attractors: analytical approach
# comopute the negative precision matrix via nilearn
from nilearn.connectome import ConnectivityMeasure
correlation_measure = ConnectivityMeasure(kind='precision',  vectorize=False, discard_diagonal=False) # uses Ledoit-Wolf estimator
correlation_measure.fit_transform(all_ts)
J = -1 * correlation_measure.mean_
def compute_W_from_J(J, num_attractors=None):
if num_attractors is None:
num_attractors = J.shape[0]
# Eigenvalue decomposition of J
eigenvalues, eigenvectors = np.linalg.eigh(J)
# Sort eigenvalues and corresponding eigenvectors in descending order
idx = np.argsort(eigenvalues)[::-1]
eigenvalues = eigenvalues[idx]
eigenvectors = eigenvectors[:, idx]
# Select the first `num_hidden_nodes` eigenvalues and eigenvectors
selected_eigenvalues = eigenvalues[:num_attractors]
selected_eigenvectors = eigenvectors[:, :num_attractors]
# Compute the weight matrix W
W = selected_eigenvectors * np.sqrt(-selected_eigenvalues)
return Wfrom connattractor import network
num_attractors = 7
# analytical solution
W = compute_W_from_J(J, num_attractors = num_attractors)
# fcHNN solution already stored in attractors_fchnn
# we change the order to match the analytical solution
attractor_states_fchnn = np.array([k for i, (k, v) in enumerate(attractors_fchnn)])
indices = [None, 1, 0, 4, 5, 2, 3]
fig, axs = plt.subplots(ncols=2, nrows=num_attractors, figsize=(16, 2*num_attractors))
for i in range(num_attractors):
print(i)
if i == 0:
network.State(np.zeros(122)).plot(plot_abs=False, figure=fig, axes=axs[i, 0], annotate=False, colorbar=False)
state_analytic = network.State(-1*W[:,i]) # *-1 for visualization
state_analytic.plot(plot_abs=False, figure=fig, axes=axs[i, 1], annotate=False, colorbar=False)
else:
network.State(attractor_states_fchnn[indices[i]]).plot(plot_abs=False, figure=fig, axes=axs[i, 0], annotate=False, colorbar=False)
if i % 2 == 0:
state_analytic = network.State(W[:,int((i+1)/2)]) # original
state_analytic.plot(plot_abs=False, figure=fig, axes=axs[i, 1], annotate=False, colorbar=False)
else:
state_analytic = network.State(-1*W[:,int((i+1)/2)]) # inverse
state_analytic.plot(plot_abs=False, figure=fig, axes=axs[i, 1], annotate=False, colorbar=False)
plt.show()0
/Users/tspisak/src/ghost-in-the-machine/venv/lib/python3.9/site-packages/nilearn/plotting/displays/_slicers.py:308: UserWarning: empty mask
  ims = self._map_show(img, type="imshow", threshold=threshold, **kwargs)
1
2
3
4
5
6
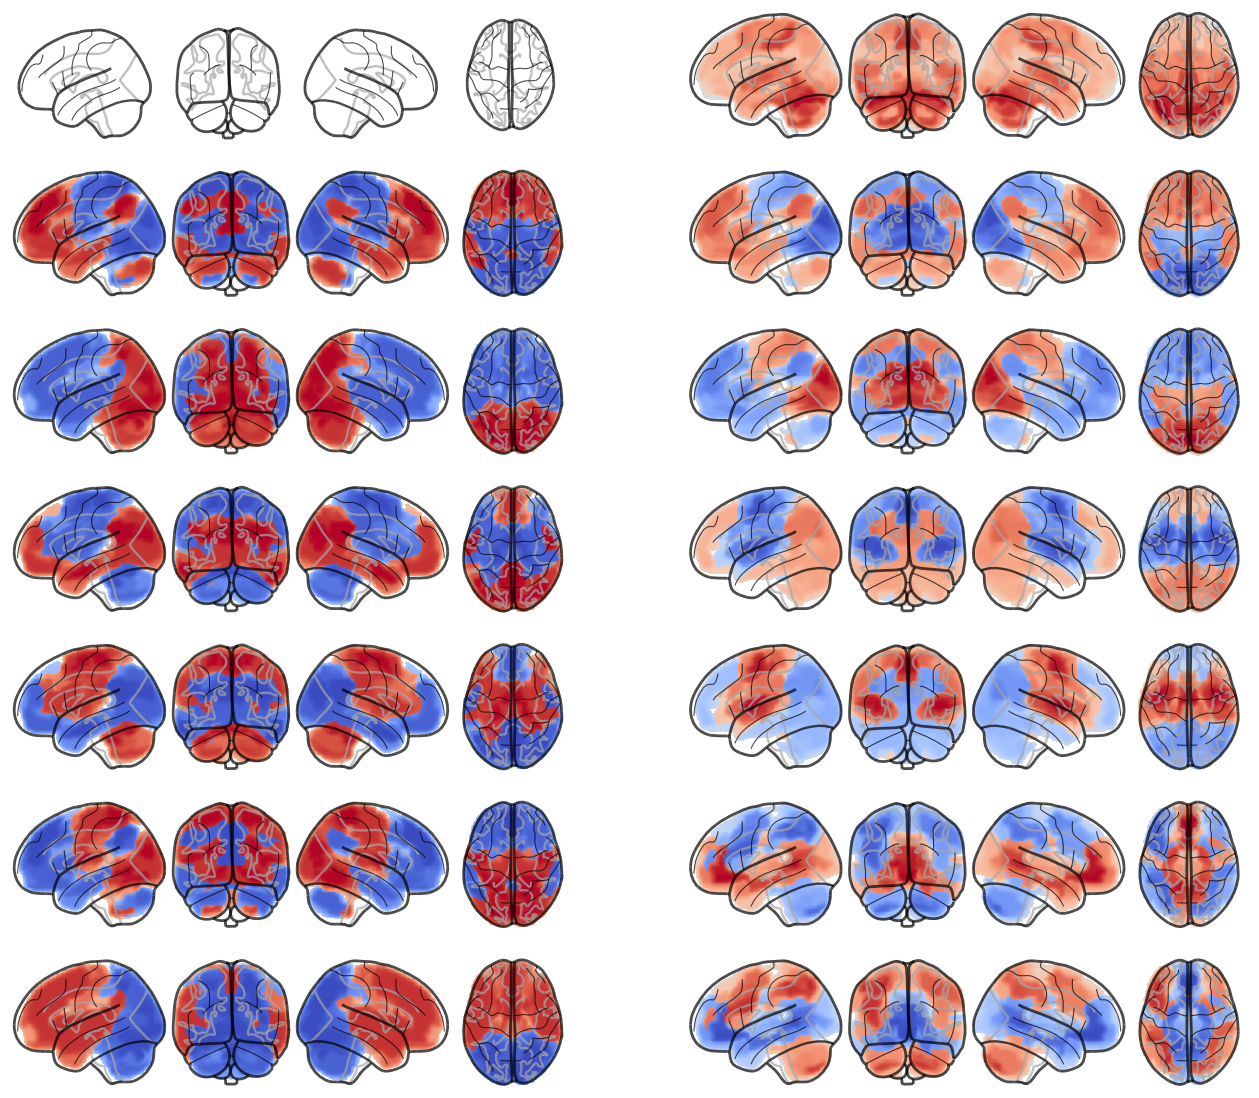
attractor_states_fchnn.shape(20, 122)# check orthogonality
# collapse fchnn attractor states
attractor_states_fchnn_collapsed = []
for a in attractor_states_fchnn:
skip = False
for a2 in attractor_states_fchnn_collapsed:
if np.all(np.isclose(-a, a2)):
skip = True
break
if not skip:
attractor_states_fchnn_collapsed.append(a)
sns.heatmap(np.round(100*np.power(np.corrcoef(attractor_states_fchnn_collapsed), 2)).astype(int), cmap='coolwarm', center=0, annot=True)
plt.show()
W = compute_W_from_J(J, num_attractors = 10)
sns.heatmap(np.round(100*np.power(np.corrcoef(W.transpose()), 2)).astype(int), cmap='coolwarm', center=0, annot=True)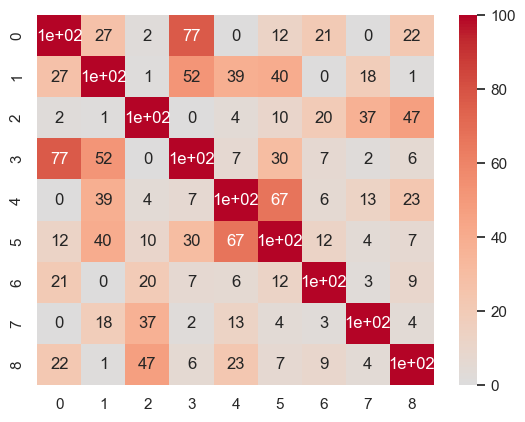
<Axes: >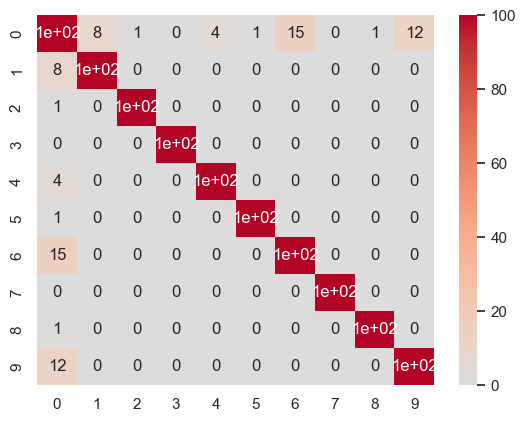
J_zerodiag = J - np.diag(np.diag(J))
eigenvalues, eigenvectors = np.linalg.eigh(-J_zerodiag)
sns.lineplot(eigenvalues[::-1])
plt.axhline(0, color='black', linewidth=0.5, linestyle='--')
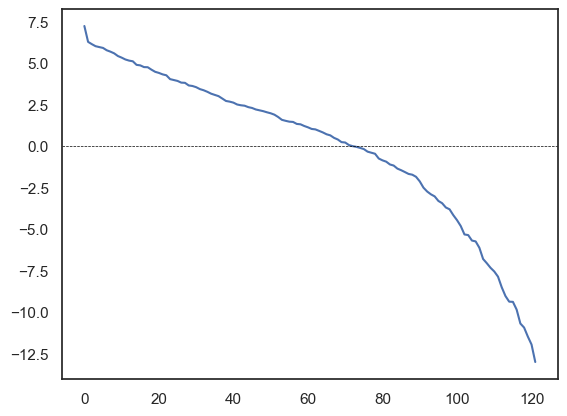
for a in attractor_states_fchnn_collapsed:
    network.State(a).plot()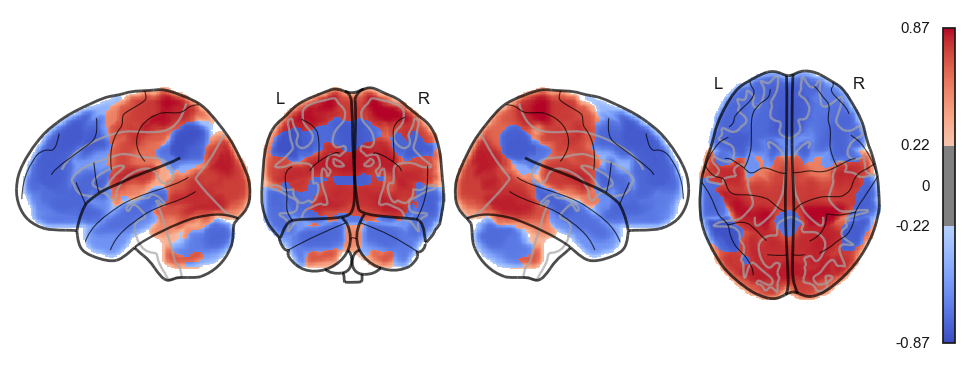
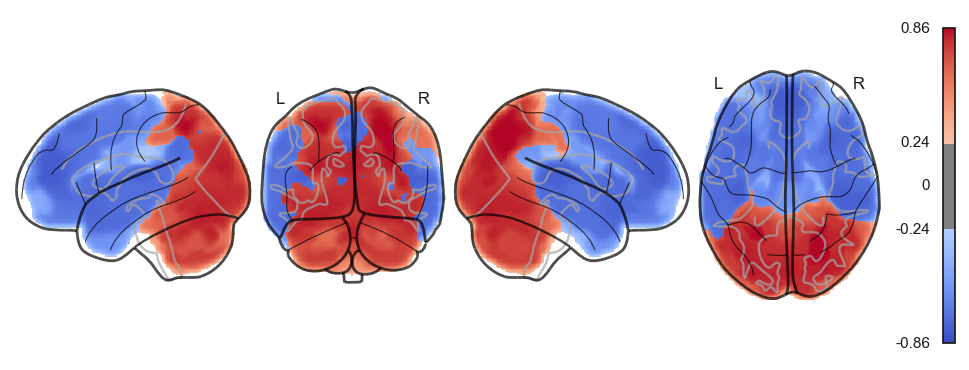
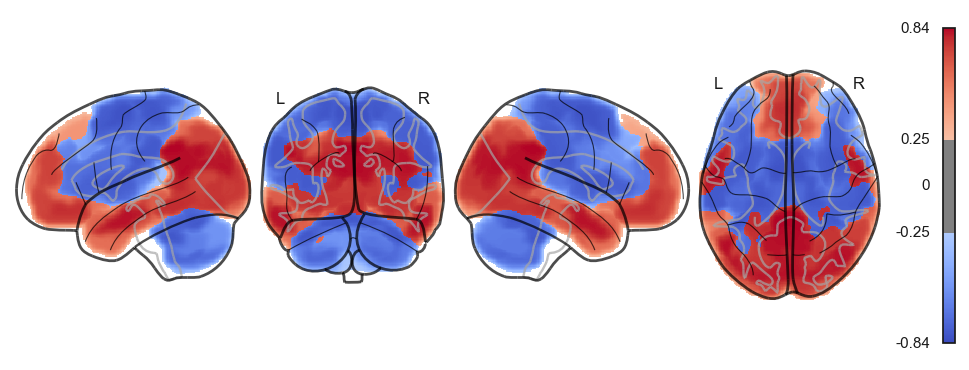
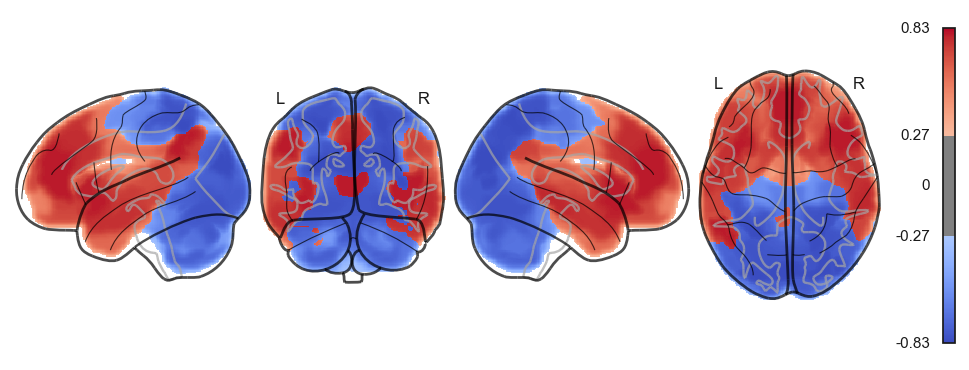
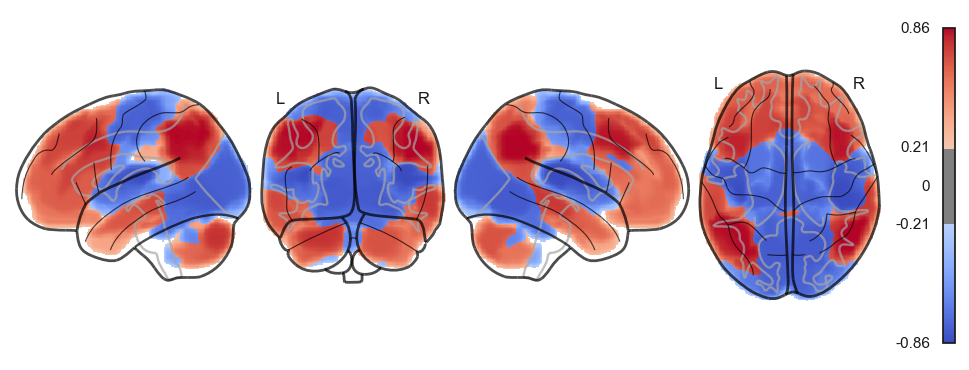
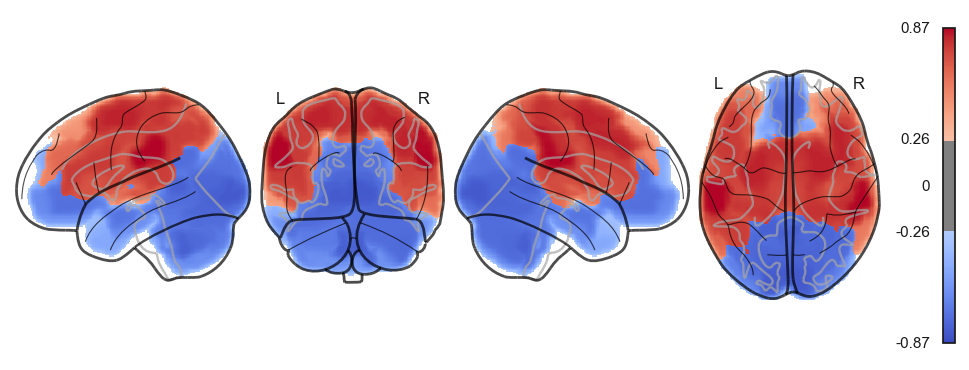
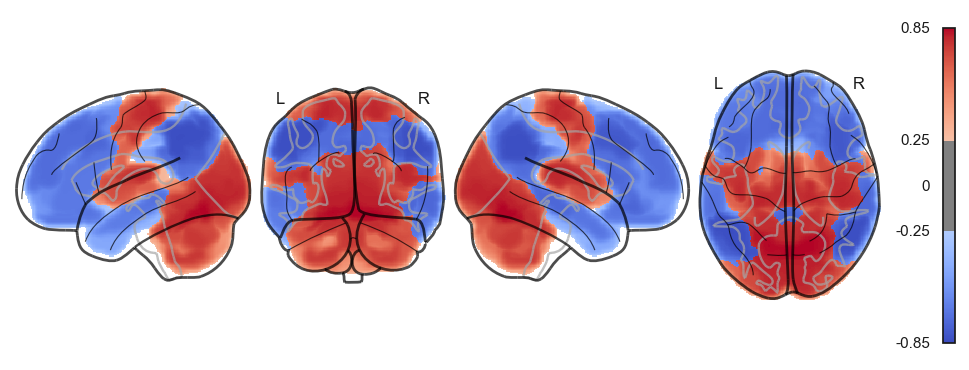
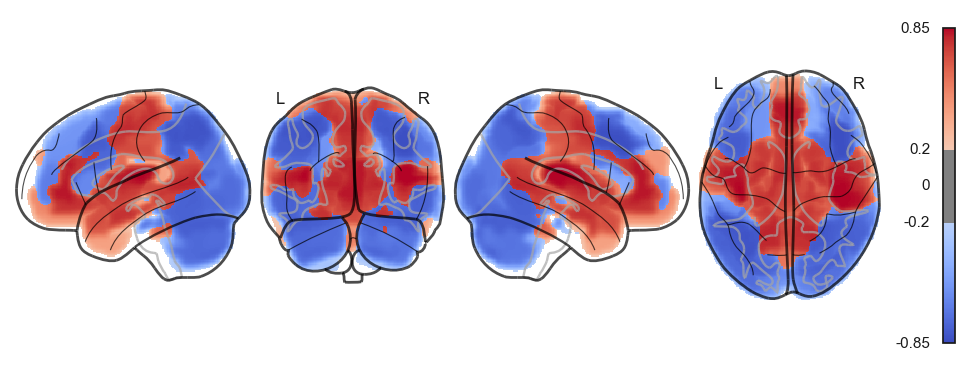
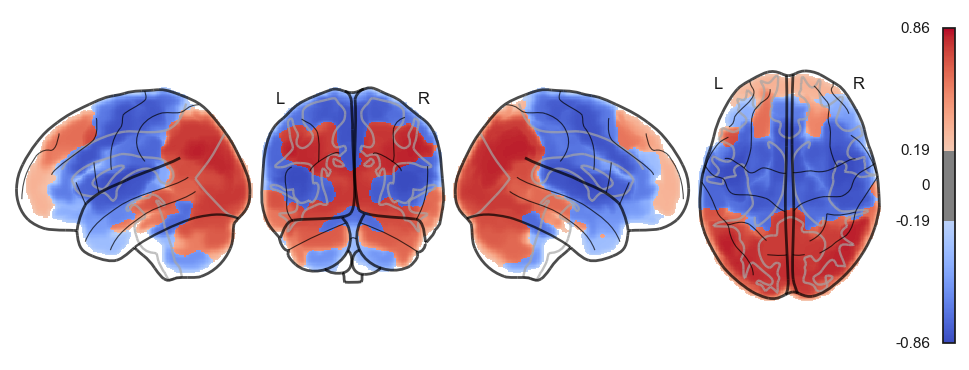
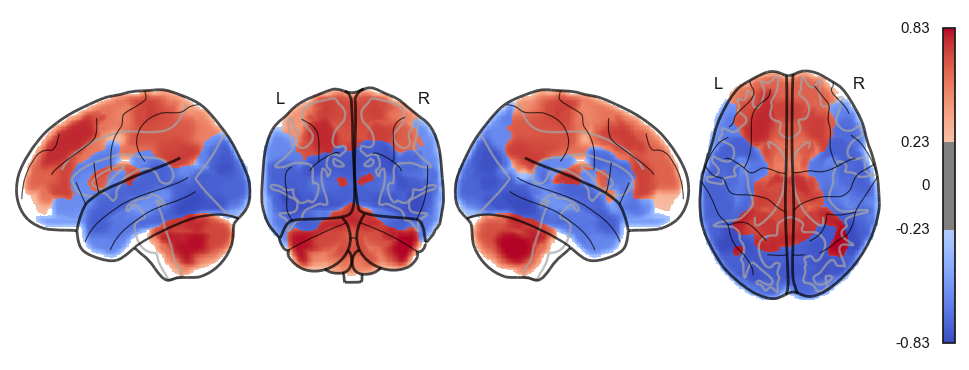
sns.clustermap(np.power(np.corrcoef(attractor_states_fchnn_collapsed), 2), cmap='coolwarm', center=0)<seaborn.matrix.ClusterGrid at 0x1538e0100>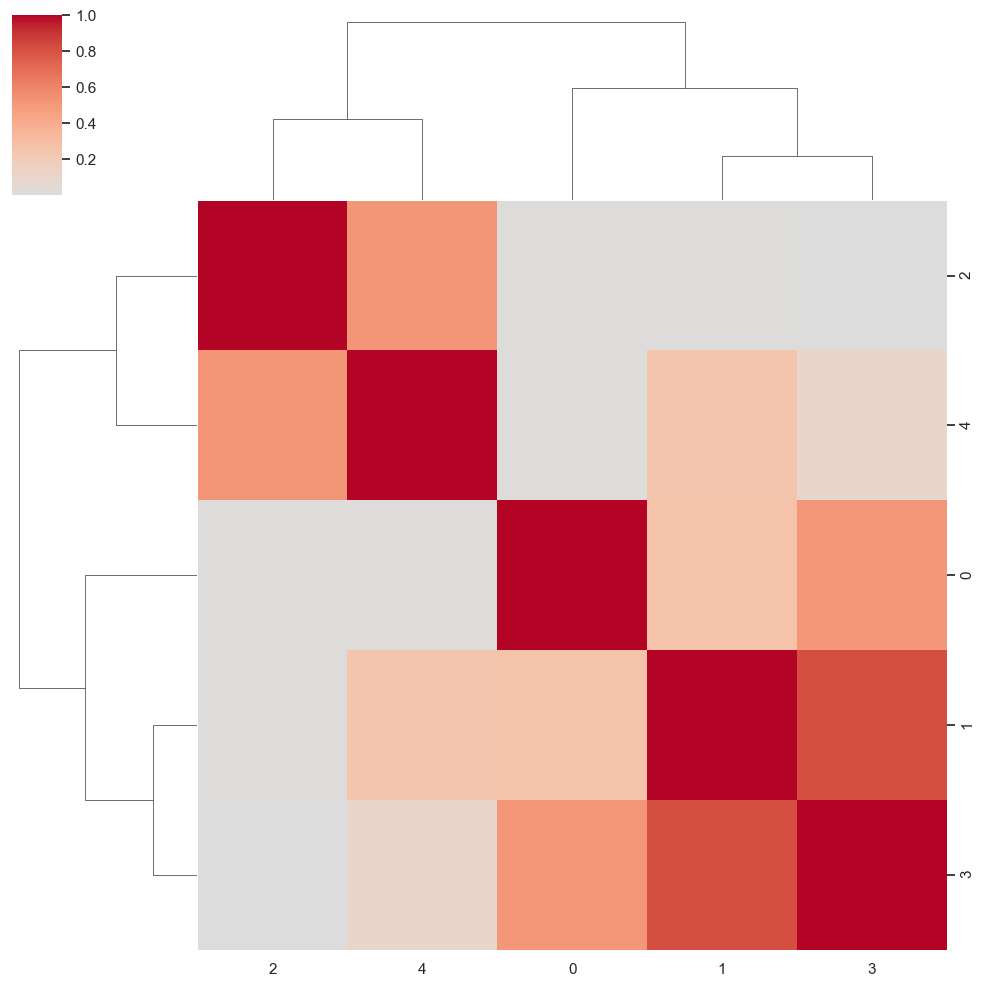
from connattractor import network

num_attractors = 5

from nilearn import surface, plotting, datasets
fsaverage = datasets.fetch_surf_fsaverage('fsaverage6')
surf = surface.load_surf_mesh('data/full_brain_left.surf.gii')
bg_map = np.hstack((surface.load_surf_data(fsaverage.sulc_left),
                    np.zeros(28935))) # magic number: number of cerebellum vertices (SUIT cerebellum template)

# analytical solution
W = compute_W_from_J(J, num_attractors = num_attractors)

# fcHNN solution already stored in attractors_fchnn
# we change the order to match the analytical solution
attractor_states_fchnn = np.array([k for i, (k, v) in enumerate(attractors_fchnn)])
indices = [None, 1, 0, 2, 3]

fig, axs = plt.subplots(ncols=2, nrows=num_attractors, figsize=(4, 2*num_attractors), subplot_kw={'projection': '3d'})
for i in range(num_attractors):
    print(i)
    if i == 0:
        network.State(np.ones(122)).plot(plot_abs=False, figure=fig, axes=axs[i, 0], annotate=False, colorbar=False)

        texture = np.zeros(surf.coordinates.shape[0])
        fig = plotting.plot_surf_stat_map(surf, texture, bg_map=bg_map, bg_on_data=True, hemi='left', colorbar=False, cmap='purple_green_r', threshold=0, figure=fig, axes=axs[i, 0])

        img = network.State(-1*W[:,i]).to_Nifti1Image()
        texture = surface.vol_to_surf(img, surf)
        fig = plotting.plot_surf_stat_map(surf, texture, bg_map=bg_map, bg_on_data=True, hemi='left', colorbar=False, cmap='purple_green_r', threshold=0, figure=fig, axes=axs[i, 1])

    else:
        img = network.State(attractor_states_fchnn[indices[i]]).to_Nifti1Image()
        texture = surface.vol_to_surf(img, surf)
        fig = plotting.plot_surf_stat_map(surf, texture, bg_map=bg_map, bg_on_data=True, hemi='left', colorbar=False, cmap='purple_green_r', threshold=0, figure=fig, axes=axs[i, 0])

        if i % 2 == 0:
            img = network.State(W[:,int((i+1)/2)]).to_Nifti1Image()
            texture = surface.vol_to_surf(img, surf)
            fig = plotting.plot_surf_stat_map(surf, texture, bg_map=bg_map, bg_on_data=True, hemi='left', colorbar=False, cmap='purple_green_r', threshold=0, figure=fig, axes=axs[i, 1])
        else:

            img = network.State(-1*W[:,int((i+1)/2)]).to_Nifti1Image()
            texture = surface.vol_to_surf(img, surf)
            fig = plotting.plot_surf_stat_map(surf, texture, bg_map=bg_map, bg_on_data=True, hemi='left', colorbar=False, cmap='purple_green_r', threshold=0, figure=fig, axes=axs[i, 1])
plt.show()
0
/Users/tspisak/src/ghost-in-the-machine/venv/lib/python3.9/site-packages/nilearn/plotting/surf_plotting.py:522: RuntimeWarning: invalid value encountered in divide
  data_copy /= (vmax - vmin)
1
2
3
4
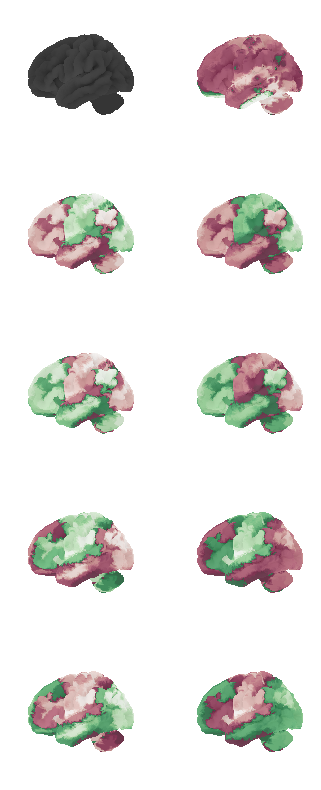
from connattractor import network

num_attractors = 14

from nilearn import surface, plotting, datasets
fsaverage = datasets.fetch_surf_fsaverage('fsaverage6')
surf = surface.load_surf_mesh('data/full_brain_left.surf.gii')
bg_map = np.hstack((surface.load_surf_data(fsaverage.sulc_left),
                    np.zeros(28935))) # magic number: number of cerebellum vertices (SUIT cerebellum template)

# analytical solution
W = compute_W_from_J(J, num_attractors = num_attractors)

# fcHNN solution already stored in attractors_fchnn
# we change the order to match the analytical solution
attractor_states_fchnn = np.array([k for i, (k, v) in enumerate(attractors_fchnn)])

fig, axs = plt.subplots(ncols=2, nrows=num_attractors, figsize=(4, 2*num_attractors), subplot_kw={'projection': '3d'})

for i in range(0,num_attractors):
    print(i)

    # cmap: PiYG, cyan_orange, cold_hot, blue_red

    if i % 2 == 0:
        img = network.State(W[:,int((i)/2)]).to_Nifti1Image()
        img.to_filename(f'data/attractor_{int((i)/2)}_pos.nii.gz')
        texture = surface.vol_to_surf(img, surf)
        #texture[texture<0] = 0
        fig = plotting.plot_surf_stat_map(surf, texture, bg_map=bg_map, bg_on_data=False, hemi='left', colorbar=False, cmap='PiYG', threshold=0, figure=fig, axes=axs[i, 0], symmetric_cbar=True, vmin=-0.2, vmax=0.2, darkness=1)
        fig = plotting.plot_surf_stat_map(surf, texture, bg_map=bg_map, bg_on_data=False, hemi='right', colorbar=False, cmap='PiYG', threshold=0, figure=fig, axes=axs[i, 1], symmetric_cbar=True, vmin=-0.2, vmax=0.2, darkness=1)
    else:
        img = network.State(-1*W[:,int((i)/2)]).to_Nifti1Image()
        img.to_filename(f'data/attractor_{int((i)/2)}_neg.nii.gz')
        texture = surface.vol_to_surf(img, surf)
        #texture[texture<0] = 0
        fig = plotting.plot_surf_stat_map(surf, texture, bg_map=bg_map, bg_on_data=False, hemi='left', colorbar=False, cmap='PiYG', threshold=0, figure=fig, axes=axs[i, 0], symmetric_cbar=True, vmin=-0.25, vmax=0.25, darkness=1)
        fig = plotting.plot_surf_stat_map(surf, texture, bg_map=bg_map, bg_on_data=False, hemi='right', colorbar=False, cmap='PiYG', threshold=0, figure=fig, axes=axs[i, 1], symmetric_cbar=True, vmin=-0.25, vmax=0.25, darkness=1)
plt.show()
0
1
2
3
4
5
6
7
8
9
10
11
12
13

    from nilearn import surface, plotting, datasets
    fsaverage = datasets.fetch_surf_fsaverage('fsaverage6')
    surf = surface.load_surf_mesh('data/full_brain_left.surf.gii')
    bg_map = np.hstack((surface.load_surf_data(fsaverage.sulc_left),
                        np.zeros(28935))) # magic number: number of cerebellum vertices (SUIT cerebellum template)
    # plot control signal
    signal = np.zeros(122)
    img = network.State(signal).to_Nifti1Image()
    # due to numerical instabilities, the sign may flips, we flip ti back by np.sign(W[0,i])
    texture = surface.vol_to_surf(img, surf)
    fig = plotting.plot_surf_stat_map(surf, texture, bg_map=bg_map, bg_on_data=True, hemi='right', colorbar=False, cmap='coolwarm', threshold=0.2)
/Users/tspisak/src/ghost-in-the-machine/venv/lib/python3.9/site-packages/nilearn/plotting/surf_plotting.py:522: RuntimeWarning: invalid value encountered in divide
data_copy /= (vmax - vmin)
mist_regions = pd.read_csv('data/MIST122_relabeled.tsv', sep='\t')
mist_regions.columns = ['label', 'MIST_index', 'region', 'module']
mist_mapper=mist_regions[['label', 'region']]
mist_mapper.set_index('region', inplace=True)
mist_mapper.loc['CER6_p', 'label']
mist_regions
Loading...
# top 5 positive and negative weights for all attractors
num_attractors = 6
W = compute_W_from_J(J, num_attractors=num_attractors)
for i in range(num_attractors):
    print(f'Attractor {i}')
    print('Positive weights:')
    positive_indices = np.argsort(W[:, i])[::-1][:10]
    for idx in positive_indices:
        region = mist_mapper.loc[mist_mapper['label'] == idx+1].index[0]
        weight = W[idx, i]
        print(f'{region}: {weight}')

    print('Negative weights:')
    negative_indices = np.argsort(W[:, i])[:10]
    for idx in negative_indices:
        region = mist_mapper.loc[mist_mapper['label'] == idx+1].index[0]
        weight = W[idx, i]
        print(f'{region}: {weight}')
Attractor 0
Positive weights:
CAUDN_d: -0.029162733705919222
CAUDN_v: -0.029913861560616557
L_FP_l: -0.03052107551342619
CER9_v: -0.031076792708045597
MORBgyr: -0.03135729158690755
L_IPlob: -0.03257299396868412
R_IPsul: -0.03294407483393789
R_PORB: -0.033908817033520326
R_SFsul: -0.03414525292692405
CAUDNH_NACC: -0.03459427956450505
Negative weights:
CERCR1: -0.06549308045644132
CER6_d: -0.06352514081556686
CER7ab: -0.06179504103298891
CER9_d: -0.06142742057850851
IMsul: -0.06099539642420349
CER6_a: -0.06033161355209502
OCCTgyr_l: -0.06032212974110367
CER5: -0.059359176123587556
STgyr_m: -0.05819294631300821
CER6_p: -0.05779996873352816
Attractor 1
Positive weights:
MDVISnet_p: 0.18752249260591838
VVISnet_m: 0.1747968111370961
PVISnet_dm: 0.17156349818802774
LVISnet_DP: 0.16842649285829975
VVISnet_l: 0.1658470826222736
MDVISnet_a: 0.16543711892009066
MVISnet_av: 0.16423718755797911
MVISnet_p: 0.15078152873745287
LVISnet_p: 0.14502950793373404
PVISnet_vm: 0.14481865145851291
Negative weights:
CAUDN: -0.15309219414818268
SFgyr_ad: -0.1469411219609312
DMPFcor_ac: -0.14551790121430339
PIsul: -0.14407394658587228
L_IPlob: -0.14362070309677147
DMPFcor_p: -0.13371394565629321
DMPFC_ar: -0.13069932583218272
R_IPlob: -0.1277010866376052
L_IPlob: -0.12441015596369463
LORBgyr: -0.12076728204802925
Attractor 2
Positive weights:
AINS_pd: 0.21618496218175698
PINS_d: 0.21264621029055972
MOTnet_am: 0.21114573521483126
PSMcor_p: 0.20707563086953565
PUT_p: 0.1981496019178994
CNGsul_p: 0.18842243326738412
HSgyr: 0.17865992047762214
PINS_v: 0.17226250225856546
AINS_v: 0.16999375005007314
PUT_a: 0.16069186542914474
Negative weights:
DVIS_vl: -0.15865403839150138
PCcor: -0.14093287756427827
POsul_d: -0.13968082464680806
POsul: -0.13652007646168873
PRC_v: -0.13427368177735444
R_IPlob: -0.13408029979963404
L_DVIS_v: -0.1323354889254767
L_IPlob: -0.12896778944935197
R_DVIS_v: -0.12740339472086198
PRC_d: -0.12357214090266258
Attractor 3
Positive weights:
L_IPsul: 0.20788466049716126
CER7b_m: 0.20302972906416153
L_IFsul: 0.19867318495825242
R_IPsul: 0.18103437825051005
R_PCsul: 0.1758834049489388
L_MFgyr_pc: 0.169170827338004
l_PCsul: 0.168501024842266
DVIS_s: 0.1684599913883102
L_MFgyr_pr: 0.15745869246855776
FEF: 0.1569541153585665
Negative weights:
VMPFcor_p: -0.22026638233988527
POsul_v: -0.21785505004172556
PGACcor: -0.21206319378781177
HIPP: -0.20209218050522879
CAUDNH_NACC: -0.19932757452698152
AMY: -0.18868358633997456
POsul: -0.18777300229621255
MVISnet_ad: -0.18043744725466598
CERVM: -0.14683751104294696
COLsul: -0.1462926898749829
Attractor 4
Positive weights:
L_ANGgyr: 0.17298151672179032
MORBgyr: 0.16550356108649011
R_MTgyr_a: 0.15751112366005715
L_MTgyr_a: 0.15699639513137348
L_IPlob: 0.15500929101561997
L_MTgyr_p: 0.15112034199294633
R_MTgyr_p: 0.15058117509046623
STgyr_a: 0.14342825228825862
R_ANGgyr: 0.1424262007201003
L_MOTnet_dl: 0.13056088744844105
Negative weights:
CAUDN_d: -0.2830649119874886
CER6_a: -0.26278715690168436
R_CERCR2_a: -0.22907641256881495
CAUDN: -0.22467533917968327
CER5: -0.21931797844855738
CER6_d: -0.21822725110862076
CER9_d: -0.2135159554833823
L_CERCR2_a: -0.20950851533975223
THAL_d: -0.206876854012057
CER6_p: -0.20597057464472168
Attractor 5
Positive weights:
L_VLPFcor: 0.27909196771652245
TP: 0.2506369176984001
MORBgyr: 0.22572443574608786
R_CERCR2_p: 0.223931436182671
ITgyr: 0.21905097681571428
LORBgyr: 0.2150051084948697
STgyr_a: 0.21277590838721597
L_MTgyr_p: 0.20580142763511214
PVISnet_l: 0.19514558497426002
LVISnet_vp: 0.18374039008750187
Negative weights:
R_SFsul: -0.3159055435866835
POsul_d: -0.2908571946977753
PRC_d: -0.2685267631262202
POsul: -0.24414568950200052
R_MFgyr_p: -0.22061405871592996
R_IPlob: -0.21029102837476663
PCcor: -0.2075018758949275
PRC_d: -0.20334536653884572
PRC_v: -0.20049899099150043
PCcor: -0.1954702439343784
num_attractors = 122
W = compute_W_from_J(J, num_attractors=num_attractors)
# do tsne on the weights
from sklearn.manifold import TSNE

def hn_energy(state, threshold=None):
    if threshold is None:
        threshold = np.zeros_like(state)
    return  -0.5 * state @ J @ state + state @ threshold

W_paired = []
for i in range(0, num_attractors):
    W_paired.append(W[:,i])
    W_paired.append(-W[:,i])
W_paired = np.array(W_paired)

sample = np.vstack(all_ts)
sample = np.vstack((W_paired, sample))
energies = np.array([hn_energy(s) for s in sample]).reshape(sample.shape[0], 1)
energies = (energies - np.mean(energies))/np.std(energies) * 10
sample = np.hstack((sample, energies))

tsne = TSNE(n_components=2, perplexity=2, random_state=42)
W_tsne = tsne.fit_transform(sample)
#plot it
plt.figure(figsize=(8,8))
plt.scatter(W_tsne[:,0], W_tsne[:,1], alpha=1, c=energies, cmap='coolwarm', s=5, linewidth=0)

plt.scatter(W_tsne[:W_paired.shape[0],0], W_tsne[:W_paired.shape[0],1], alpha=1, c=energies[:W_paired.shape[0]],
            cmap='coolwarm', s=10, linewidth=2, vmin=np.min(energies), vmax=np.max(energies))

#for i, txt in enumerate(range(1, len(W_tsne))):
#   plt.annotate(mist_regions.iloc[i-1, 2], (W_tsne[i,0], W_tsne[i,1]), fontsize=6)
#plt.show()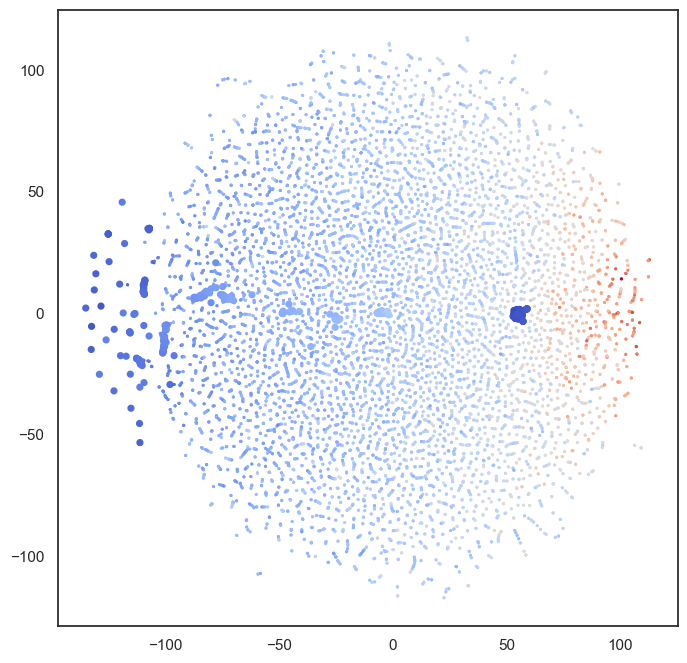
plt.scatter(W_tsne[:W_paired.shape[0],0], W_tsne[:W_paired.shape[0],1], alpha=1, c=energies[:W_paired.shape[0]],
            cmap='coolwarm', s=10, linewidth=2, vmin=np.min(energies), vmax=np.max(energies))
for i, txt in enumerate(range(1, 60)):
   plt.annotate(i, (W_tsne[i,0], W_tsne[i,1]), fontsize=6)
plt.show()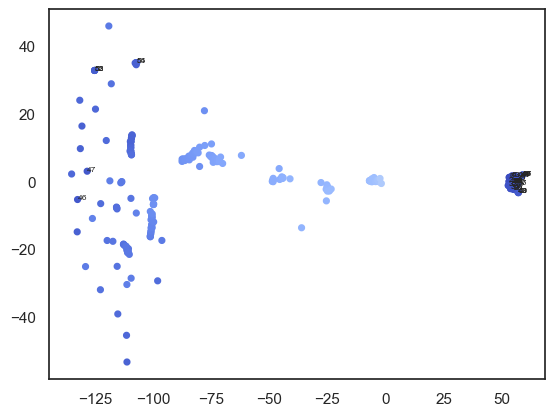
W = compute_W_from_J(J, num_attractors=12)
# do tsne on the weights
from sklearn.manifold import TSNE
tsne = TSNE(n_components=2, perplexity=5, random_state=42)
W_tsne = tsne.fit_transform(W)
#plot it
plt.figure(figsize=(6,6))
plt.scatter(W_tsne[:,0], W_tsne[:,1], alpha=0.5)
# add labels
for i, txt in enumerate(range(1, len(W_tsne))):
    plt.annotate(mist_regions.iloc[i-1, 2], (W_tsne[i,0], W_tsne[i,1]), fontsize=6)
plt.show()attractor_states_fchnn.shape(20, 122)def hn_energy(state, threshold=None):
if threshold is None:
threshold = np.zeros_like(state)
return -0.5 * state @ J @ state + state @ threshold
def plot_manifold(num_attractors = 6, perplexity=None, smooth_sigma=0.8,
energy=hn_energy, threshold=None,
filename=None):
from openTSNE import TSNE
if threshold is None:
threshold = np.zeros_like(state)
W = compute_W_from_J(J, num_attractors=num_attractors)
if perplexity is None:
perplexity = (num_attractors+1)/3
W_paired = []
for i in range(0, num_attractors):
W_paired.append(W[:,i])
W_paired.append(-W[:,i])
W_paired = np.array(W_paired).T
#W_paired = attractor_states_fchnn.T
# do tsne on the weights
tsne = TSNE(n_components=2, perplexity=perplexity, initialization='pca', metric="euclidean", random_state=42, n_jobs=16)
tsne_embedding = tsne.fit(W_paired.transpose())
W_tsne = tsne_embedding[:num_attractors*2,:]
W_paired = W_paired[:,:num_attractors*2]
#transform sample
sample = np.vstack(all_ts)
sample_tsne = tsne_embedding.transform(sample, perplexity=perplexity)
from scipy.stats import binned_statistic_2d
energies = np.array([energy(sample[i], threshold) for i in range(sample.shape[0])])
mean_energy = binned_statistic_2d(sample_tsne[:,0], sample_tsne[:,1], values=energies, statistic='mean', bins=20)
# smooth ean_energy.statistic
from scipy.ndimage import gaussian_filter
mean_energy_smoothed = np.copy(mean_energy.statistic)
grand_mean = np.mean(mean_energy_smoothed[~ np.isnan(mean_energy_smoothed)])
mean_energy_smoothed[np.isnan(mean_energy_smoothed)] = grand_mean # mean inputting
mean_energy_smoothed = gaussian_filter(mean_energy_smoothed, sigma=smooth_sigma)
mean_energy_smoothed_nan = mean_energy_smoothed.copy()
mean_energy_smoothed_nan[np.isnan(mean_energy.statistic)] = np.nan # write back nan values
# plot
fig, axes = plt.subplots(1, 4, figsize=(16, 4))
attractor_energies = [energy(W_paired[:,i], threshold) for i in range(W_paired.shape[1])]
##########
sctplt = axes[0].scatter(sample_tsne[:,0], sample_tsne[:,1], alpha=0.5, c=[energy(sample[i], threshold) for i in range(sample.shape[0])],cmap='coolwarm', s=6, vmin=100, vmax=350, edgecolor='none')
plt.colorbar(sctplt,ax=axes[0], location='bottom', shrink=0.6, ticks=[100, 350])
axes[0].scatter(W_tsne[:,0], W_tsne[:,1], alpha=0.5, c=attractor_energies,cmap='coolwarm', s=30, edgecolors= "black", vmin=100, vmax=350)
##########
sns.kdeplot(x=sample_tsne[:,0], y=sample_tsne[:,1], ax=axes[1], cmap='Greens', cbar=True, fill=True, levels=8, thresh=0.01, alpha=1.0,antialiased=True, cbar_kws={"location":"bottom", "shrink":0.6, "ticks":[0.01, 0.1]})
axes[1].scatter(W_tsne[:,0], W_tsne[:,1], alpha=0.5, c=attractor_energies,
cmap='coolwarm', edgecolors= "black", vmin=200, vmax=280, color=None)
###########
implt = axes[2].imshow(mean_energy_smoothed_nan.transpose(), origin='lower', extent=(sample_tsne[:,0].min(), sample_tsne[:,0].max(), sample_tsne[:,1].min(), sample_tsne[:,1].max()), aspect='auto', cmap='coolwarm', vmin=200, vmax=280,
#interpolation='bicubic'
)
plt.colorbar(implt,ax=axes[2], location='bottom', shrink=0.6, ticks=[200, 280])
axes[2].scatter(W_tsne[:,0], W_tsne[:,1], alpha=0.5, c=attractor_energies,
cmap='coolwarm', edgecolors= "black", vmin=200, vmax=280, s=30)
# set limits
axes[2].set_xlim(sample_tsne[:,0].min()*1.1, sample_tsne[:,0].max()*1.1)
axes[2].set_ylim(sample_tsne[:,1].min()*1.1, sample_tsne[:,1].max()*1.1)
for i, txt in enumerate(range(0, W_tsne.shape[0])):
axes[0].annotate(txt, (W_tsne[i,0], W_tsne[i,1]))
axes[1].annotate(txt, (W_tsne[i,0], W_tsne[i,1]))
axes[2].annotate(txt, (W_tsne[i,0], W_tsne[i,1]))
sns.despine() #left=True, bottom=True)
## Surface plot:
# swap 4th subplot to 3d
axes[3].remove()
axes[3] = fig.add_subplot(1, 4, 4, projection='3d')
# Extracting the necessary information
mean_values = mean_energy_smoothed # The mean energy in each bin
x_edges = mean_energy.x_edge # The edges of the bins in the x direction
y_edges = mean_energy.y_edge # The edges of the bins in the y direction
# Calculate bin centers
x_centers = (x_edges[:-1] + x_edges[1:]) / 2
y_centers = (y_edges[:-1] + y_edges[1:]) / 2
# Create a meshgrid for the surface plot
X, Y = np.meshgrid(x_centers, y_centers)
# Plotting the 3D surface
# Surface plot
for i in range(0, W_tsne.shape[0]):
# search closes point from the meshgrid
x_idx = np.argmin(np.abs(x_centers - W_tsne[i,0]))
y_idx = np.argmin(np.abs(y_centers - W_tsne[i,1]))
#ax.scatter(x_centers[x_idx], y_centers[y_idx], mean_values[x_idx, y_idx], color='black', s=30)
axes[3].plot([x_centers[x_idx], x_centers[x_idx]],
[y_centers[y_idx],y_centers[y_idx]],
zs=[mean_values[x_idx, y_idx]+2, mean_values[x_idx, y_idx]+20], color='black')
surf = axes[3].plot_surface(X, Y, mean_values.T, cmap='coolwarm', linewidth=0.1)
axes[3].set_zlim(200, 280)
axes[3].view_init(elev=50, azim=-70)
# zoom in a bit more
#axes[3].dist = 3
zoom = 0.8
axes[3].set_xlim3d(sample_tsne[:,0].min()*zoom, sample_tsne[:,0].max()*zoom)
axes[3].set_ylim3d(sample_tsne[:,0].min()*zoom, sample_tsne[:,0].max()*zoom)
axes[3].set_zlim3d(100, 350)
# remove axes and everything
axes[3].set_axis_off()
if filename is not None:
plt.savefig(filename)
plt.show()
plot_manifold(num_attractors = 4)
plot_manifold(num_attractors = 5)
plot_manifold(num_attractors = 6, filename='fig/attractor_manifold.pdf')
plot_manifold(num_attractors = 8)
plot_manifold(num_attractors = 10)
plot_manifold(num_attractors = 16)
for t in [-6,-2,0,2,6]:
    plot_manifold(num_attractors = 4, threshold=np.repeat(t, 122))


for t in [-6,-2,0,2,6]:
    threshold = np.zeros(122)
    threshold[mist_mapper.loc['PUT_p', 'label']] = t*10
    plot_manifold(num_attractors = 6, threshold=threshold)


mist_mapper.index.valuesarray(['CER6_p', 'CER7ab', 'R_CERCR2_p', 'CER9_v', 'CER6_a', 'L_CERCR2_a',
'CER9_d', 'CER9_m', 'CER7b_m', 'L_CERCR2_p', 'CER7b_l', 'N',
'CERCR1', 'CER6_d', 'CER5', 'R_CERCR2_a', 'POsul_d', 'POsul_v',
'VMPFcor_p', 'R_MTgyr_a', 'L_ANGgyr', 'L_MTgyr_p', 'L_MTgyr_a',
'DMPFC_ar', 'L_SFsul_a', 'DMPFcor_ac', 'PCcor', 'POsul', 'L_IPlob',
'PGACcor', 'VMPFcor_a', 'PRC_d', 'SFgyr_ad', 'L_IPlob', 'R_ANGgyr',
'PRC_v', 'R_MTgyr_p', 'PRC_d', 'R_MFgyr_a', 'L_DVIS_v', 'SPlob',
'R_VLPFcor', 'FUSgyr_vl', 'R_IFsul', 'FP', 'R_DVIS_v', 'L_FP_l',
'SPlob', 'L_MFgyr_pc', 'L_VLPFcor', 'OCCTgyr_l', 'ACcor_d',
'L_MFgyr_pr', 'R_MFgyr_p', 'R_IPsul', 'L_IFsul', 'DVIS_s',
'FUSgyr_dl', 'R_SFsul', 'R_IPlob', 'R_FP_l', 'R_PORB', 'DMPFcor_p',
'L_IPsul', 'L_MFgyr_a', 'DVIS_vl', 'CAUDNH_NACC', 'COLsul',
'LORBgyr', 'ITgyr', 'STgyr_a', 'MORBgyr', 'PINS_v', 'TP', 'HIPP',
'AMY', 'PIsul', 'CERVM', 'L_MOTnet_dl', 'MOTnet_am', 'R_MOTnet_dl',
'MOTnet_m', 'MOTnet_ml', 'MOTnet_vl', 'MOTnet_l', 'l_PCsul',
'CNGsul_p', 'PUT_p', 'AINS_pd', 'CAUDN_d', 'AINS_v', 'FEF',
'PCsul_d', 'IMsul', 'STgyr_p', 'CAUDN_v', 'PUT_a', 'HSgyr',
'PSMcor_p', 'PSMcor_a', 'SMgyr', 'THAL_d', 'THAL_v', 'R_PCsul',
'PINS_d', 'STgyr_m', 'PCcor', 'AINS_ad', 'CAUDN', 'PVISnet_l',
'MDVISnet_p', 'MDVISnet_a', 'LVISnet_vp', 'MVISnet_p',
'MVISnet_av', 'LVISnet_p', 'PVISnet_dm', 'PVISnet_vm',
'MVISnet_ad', 'VVISnet_l', 'LVISnet_DP', 'VVISnet_m'], dtype=object)from connattractor import network
from nilearn import surface, plotting, datasets
fsaverage = datasets.fetch_surf_fsaverage('fsaverage6')
surf = surface.load_surf_mesh('data/full_brain_left.surf.gii')
bg_map = np.hstack((surface.load_surf_data(fsaverage.sulc_left),
np.zeros(28935))) # magic number: number of cerebellum vertices (SUIT cerebellum template)
W = compute_W_from_J(J, num_attractors=num_attractors)
num_attractors = 6
W_paired = []
for i in range(0, num_attractors):
W_paired.append(W[:,i])
W_paired.append(-W[:,i])
W_paired = np.array(W_paired).T
fig, axes = plt.subplots(nrows=num_attractors*2, ncols=2, figsize=(4, 3*num_attractors), subplot_kw={'projection': '3d'})
for i in range(num_attractors*2):
img = network.State(W_paired[:,i]).to_Nifti1Image()
texture = surface.vol_to_surf(img, surf)
fig = plotting.plot_surf_stat_map(surf, texture, bg_map=bg_map, bg_on_data=True, hemi='left', colorbar=False, cmap='coolwarm', threshold=0, figure=fig, axes=axes[i, 0], title='Attractor {}'.format(i))
fig = plotting.plot_surf_stat_map(surf, texture, bg_map=bg_map, bg_on_data=True, hemi='right', colorbar=False, cmap='coolwarm', threshold=0, figure=fig, axes=axes[i, 1])
#plt.savefig('fig/attractor_states.pdf')
plt.show()
from connattractor import network
from nilearn import surface, plotting, datasets

fsaverage = datasets.fetch_surf_fsaverage('fsaverage6')
surf = surface.load_surf_mesh('data/full_brain_left.surf.gii')
bg_map = np.hstack((surface.load_surf_data(fsaverage.sulc_left),
                        np.zeros(28935))) # magic number: number of cerebellum vertices (SUIT cerebellum template)

W = compute_W_from_J(J, num_attractors=num_attractors)

num_attractors = 6

W_paired = []
for i in range(0, num_attractors):
     W_paired.append(W[:,i])
     W_paired.append(-W[:,i])
W_paired = np.array(W_paired).T

fig, axes = plt.subplots(nrows=num_attractors*2, ncols=1, figsize=(3, 3*num_attractors))

for i in range(num_attractors*2):
    network.State(W_paired[:,i]).plot(display_mode='x', plot_abs=False, figure=fig, axes=axes[i],
                                      title=str(i), annotate=False, colorbar=False)
#plt.savefig('fig/attractor_states.pdf')

plt.show()

from connattractor import network
# fcHNN solution
correlation_measure = ConnectivityMeasure(kind='partial correlation',  vectorize=False, discard_diagonal=False) # uses Ledoit-Wolf estimator
correlation_measure.fit_transform(all_ts)
parcor = 1 * correlation_measure.mean_
hopnet = network.Hopfield(parcor)
hopnet.W = (parcor-np.mean(parcor))/np.std(parcor) # overwrite the weights to put back the diagonal
attractors = {}
rng = np.random.default_rng(42)
for i in range(1000):
    res = hopnet.update(np.tanh(rng.normal(0,1,122)), threshold=0, beta=0.055, num_iter=10000)
    if res[1]<10000: # converged
        state = tuple(np.round(res[0], 6))
        if state not in attractors.keys():
            attractors[state] = 1
        else:
            attractors[state] += 1

attractors_fchnn = sorted(attractors.items(), key=lambda item: item[1])[::-1]
len(attractors_fchnn)4def_control_signals = [1, 2, 1000] #np.logspace(-0.5,0.5,5)
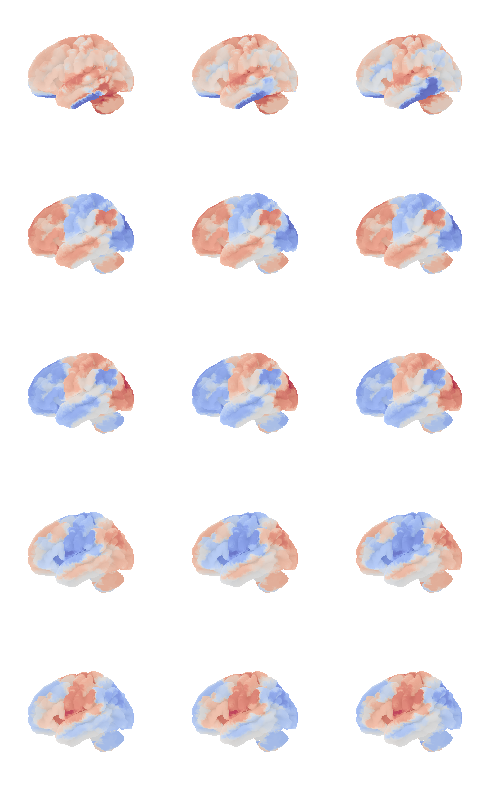
def control_signal_analysis(conrol_sigmal_index, control_signals = def_control_signals, num_attractors = 5):
W_null = compute_W_from_J(J, num_attractors = num_attractors)
from nilearn import surface, plotting, datasets
fsaverage = datasets.fetch_surf_fsaverage('fsaverage6')
surf = surface.load_surf_mesh('data/full_brain_left.surf.gii')
bg_map = np.hstack((surface.load_surf_data(fsaverage.sulc_left),
np.zeros(28935))) # magic number: number of cerebellum vertices (SUIT cerebellum template)
# plot control signal
signal = np.zeros(122)
print(conrol_sigmal_index)
for idx in conrol_sigmal_index:
signal[idx-1] = 1
img = network.State(signal).to_Nifti1Image()
# due to numerical instabilities, the sign may flips, we flip ti back by np.sign(W[0,i])
texture = surface.vol_to_surf(img, surf)
fig = plotting.plot_surf_stat_map(surf, texture, bg_map=bg_map, bg_on_data=True, hemi='left', colorbar=False, cmap='coolwarm', threshold=0.2)
fig, axs = plt.subplots(ncols=len(control_signals), nrows=num_attractors, figsize=(len(control_signals)*2, 2*num_attractors), subplot_kw={'projection': '3d'})
for i in range(num_attractors):
for j, control_signal in enumerate(control_signals):
J_stim = np.copy(J)
for idx in conrol_sigmal_index:
J_stim[idx,idx] *= control_signal
W = compute_W_from_J(J_stim, num_attractors = num_attractors)
if i == 0: # eigencentrality
signflip = -1*np.sign(np.corrcoef(W_null[:,i], W[:,i])[0,1])
img = network.State(signflip*W[:,i]).to_Nifti1Image()
# due to numerical instabilities, the sign may flips, we flip ti back by np.sign(W[0,i])
texture = surface.vol_to_surf(img, surf)
fig = plotting.plot_surf_stat_map(surf, texture, bg_map=bg_map, bg_on_data=True, hemi='left', colorbar=False, cmap='coolwarm', threshold=0, figure=fig, axes=axs[i, j])
else:
signflip = np.sign(np.corrcoef(W_null[:,int((i+1)/2)], W[:,int((i+1)/2)])[0,1])
if i % 2 == 0:
img = network.State(signflip*W[:,int((i+1)/2)]).to_Nifti1Image()
texture = surface.vol_to_surf(img, surf)
fig = plotting.plot_surf_stat_map(surf, texture, bg_map=bg_map, bg_on_data=True, hemi='left', colorbar=False, cmap='coolwarm', threshold=0, figure=fig, axes=axs[i, j])
else:
img = network.State(-1*signflip*W[:,int((i+1)/2)]).to_Nifti1Image()
texture = surface.vol_to_surf(img, surf)
fig = plotting.plot_surf_stat_map(surf, texture, bg_map=bg_map, bg_on_data=True, hemi='left', colorbar=False, cmap='coolwarm', threshold=0, figure=fig, axes=axs[i, j])
plt.show()
mist_mapper.index.values
# see also: https://simexp.github.io/multiscale_dashboard/index.html
array(['CER6_p', 'CER7ab', 'R_CERCR2_p', 'CER9_v', 'CER6_a', 'L_CERCR2_a',
'CER9_d', 'CER9_m', 'CER7b_m', 'L_CERCR2_p', 'CER7b_l', 'N',
'CERCR1', 'CER6_d', 'CER5', 'R_CERCR2_a', 'POsul_d', 'POsul_v',
'VMPFcor_p', 'R_MTgyr_a', 'L_ANGgyr', 'L_MTgyr_p', 'L_MTgyr_a',
'DMPFC_ar', 'L_SFsul_a', 'DMPFcor_ac', 'PCcor', 'POsul', 'L_IPlob',
'PGACcor', 'VMPFcor_a', 'PRC_d', 'SFgyr_ad', 'L_IPlob', 'R_ANGgyr',
'PRC_v', 'R_MTgyr_p', 'PRC_d', 'R_MFgyr_a', 'L_DVIS_v', 'SPlob',
'R_VLPFcor', 'FUSgyr_vl', 'R_IFsul', 'FP', 'R_DVIS_v', 'L_FP_l',
'SPlob', 'L_MFgyr_pc', 'L_VLPFcor', 'OCCTgyr_l', 'ACcor_d',
'L_MFgyr_pr', 'R_MFgyr_p', 'R_IPsul', 'L_IFsul', 'DVIS_s',
'FUSgyr_dl', 'R_SFsul', 'R_IPlob', 'R_FP_l', 'R_PORB', 'DMPFcor_p',
'L_IPsul', 'L_MFgyr_a', 'DVIS_vl', 'CAUDNH_NACC', 'COLsul',
'LORBgyr', 'ITgyr', 'STgyr_a', 'MORBgyr', 'PINS_v', 'TP', 'HIPP',
'AMY', 'PIsul', 'CERVM', 'L_MOTnet_dl', 'MOTnet_am', 'R_MOTnet_dl',
'MOTnet_m', 'MOTnet_ml', 'MOTnet_vl', 'MOTnet_l', 'l_PCsul',
'CNGsul_p', 'PUT_p', 'AINS_pd', 'CAUDN_d', 'AINS_v', 'FEF',
'PCsul_d', 'IMsul', 'STgyr_p', 'CAUDN_v', 'PUT_a', 'HSgyr',
'PSMcor_p', 'PSMcor_a', 'SMgyr', 'THAL_d', 'THAL_v', 'R_PCsul',
'PINS_d', 'STgyr_m', 'PCcor', 'AINS_ad', 'CAUDN', 'PVISnet_l',
'MDVISnet_p', 'MDVISnet_a', 'LVISnet_vp', 'MVISnet_p',
'MVISnet_av', 'LVISnet_p', 'PVISnet_dm', 'PVISnet_vm',
'MVISnet_ad', 'VVISnet_l', 'LVISnet_DP', 'VVISnet_m'], dtype=object)control_signal_analysis(mist_mapper.loc[['AMY'], 'label'].values)[76]
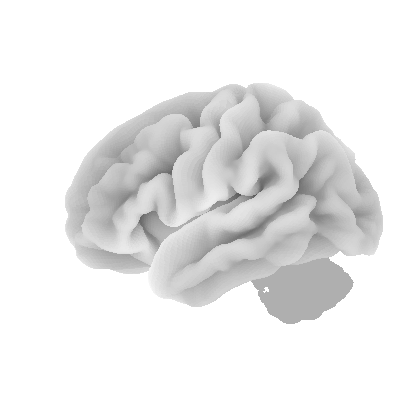
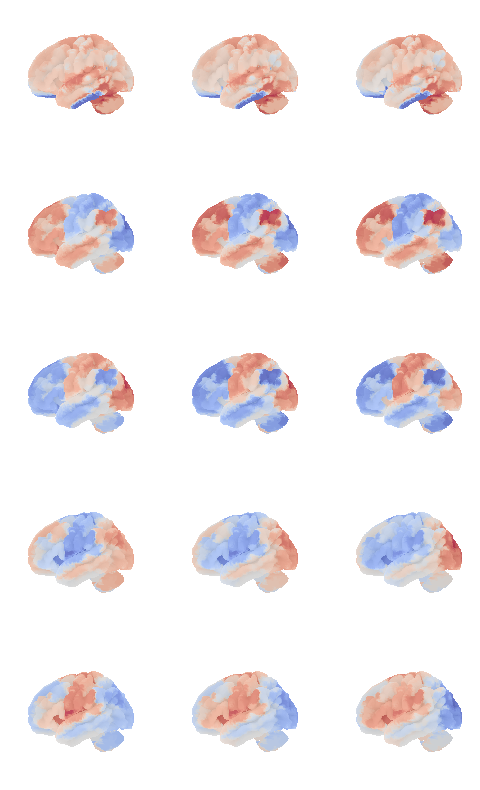
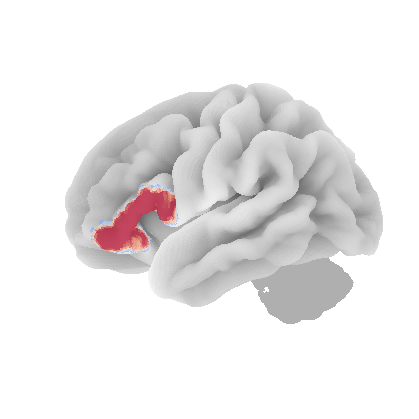
control_signal_analysis(mist_mapper.loc[['L_VLPFcor'], 'label'].values)[50]
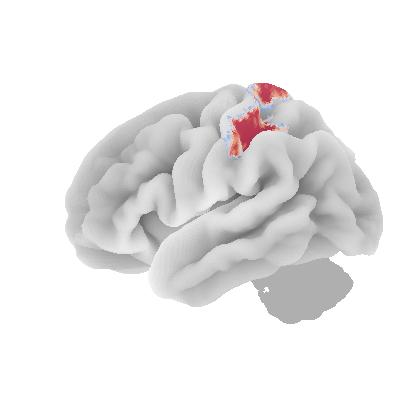
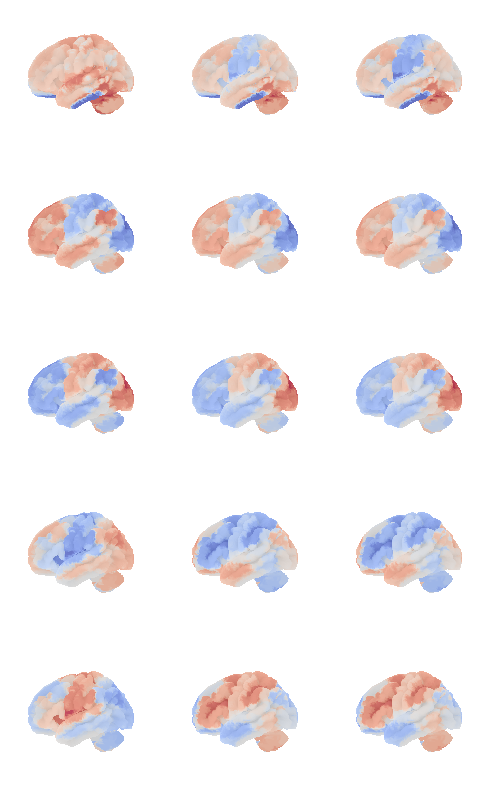
control_signal_analysis(mist_mapper.loc[['PCsul_d', 'l_PCsul', 'R_PCsul'], 'label'].values)[ 93 86 104]
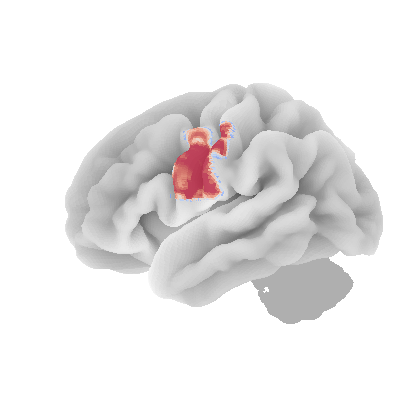
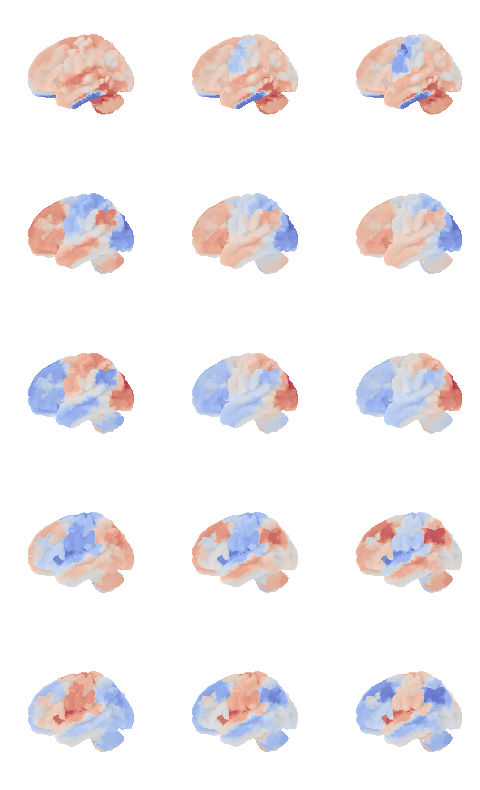
control_signal_analysis(mist_mapper.loc[['MOTnet_vl'], 'label'].values)[84]
control_signal_analysis(mist_mapper.loc[['L_ANGgyr'], 'label'].values)[21]
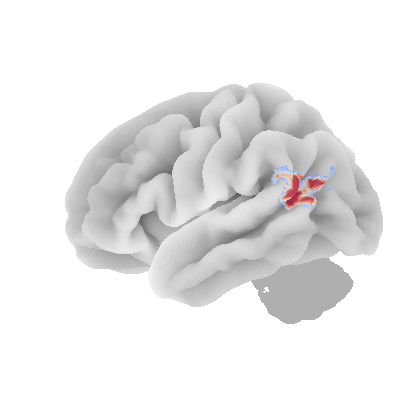
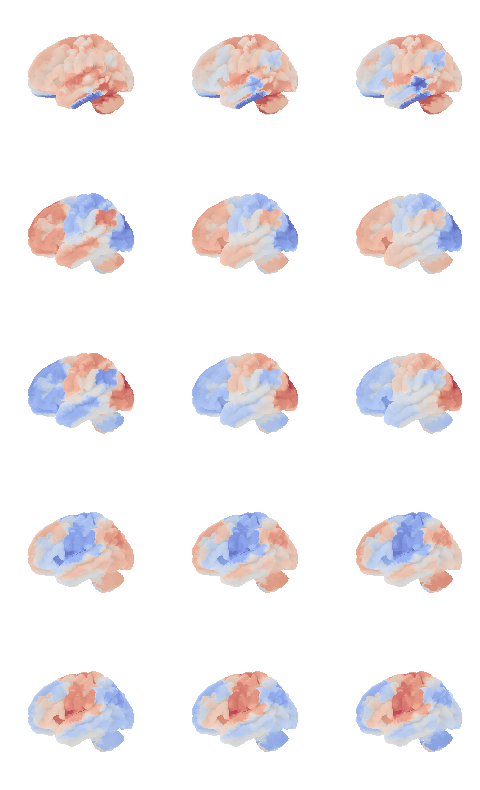
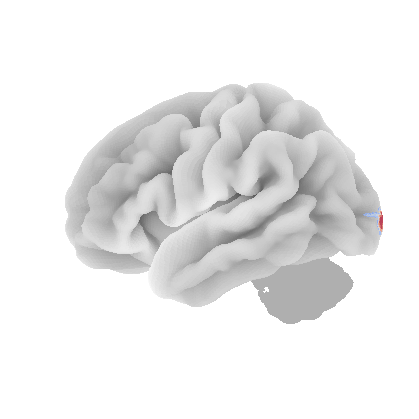
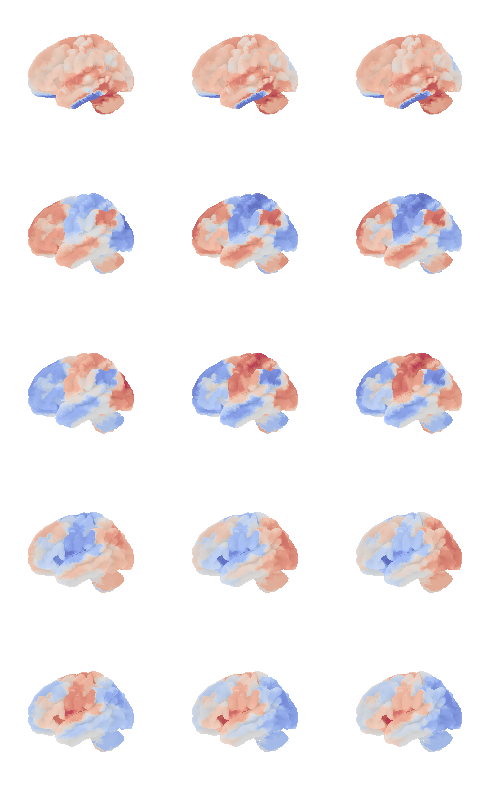
control_signal_analysis(mist_mapper.loc[['PVISnet_vm'], 'label'].values)[118]
control_signal_analysis(mist_mapper.loc[['PINS_d'], 'label'].values)[105]
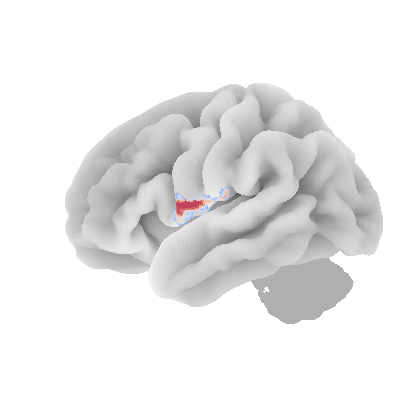
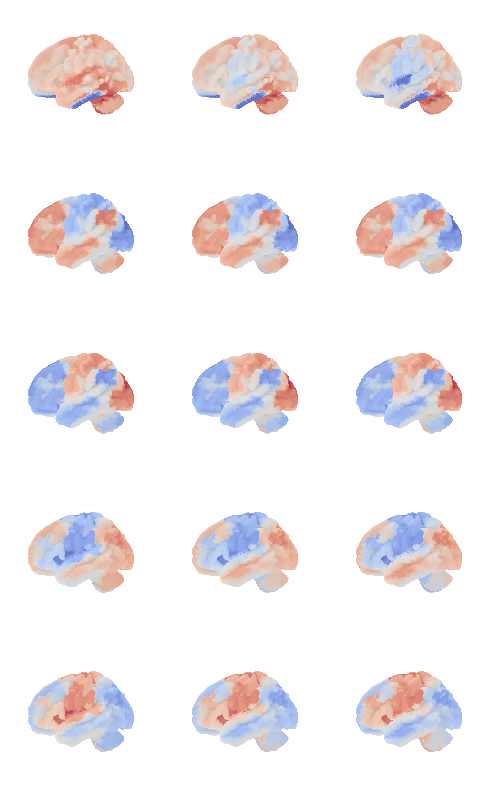
Supplementary Information 11
Connections required for a restricted Boltzmann Machine (RBM) with the same number of (hidden) integrator nodes as stored by Hopfield networks with various storage capacities.
correlation_measure = ConnectivityMeasure(kind='precision', vectorize=False, discard_diagonal=False) # uses Ledoit-Wolf estimator
M = correlation_measure.fit_transform(all_ts)
J = -1* correlation_measure.mean_
hopnet = network.Hopfield(J, scale=True)
res = hopnet.update(np.tanh(np.random.normal(0,1,122)), threshold=0, beta=0.06, num_iter=100000)
print(res[1])
network.State(res[0]).plot(plot_abs=False)
741
<nilearn.plotting.displays._projectors.LYRZProjector at 0x348165f70>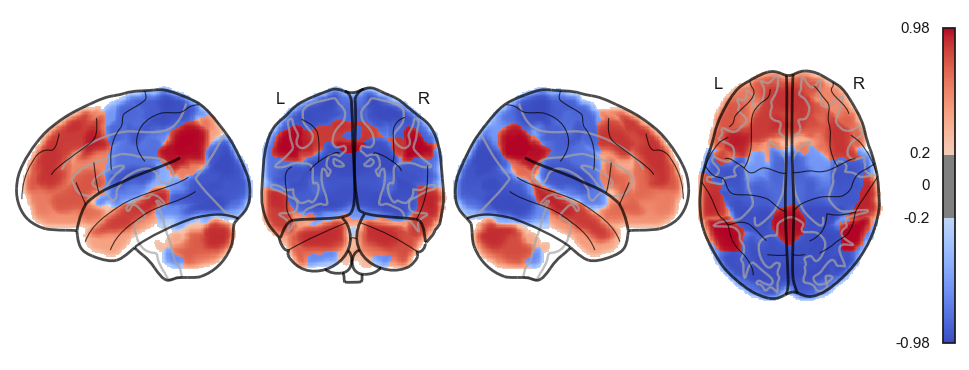
from nilearn import surface, plotting, datasets
fsaverage = datasets.fetch_surf_fsaverage('fsaverage6')
surf = surface.load_surf_mesh('data/full_brain_left.surf.gii')
bg_map = np.hstack((surface.load_surf_data(fsaverage.sulc_left),
                    np.zeros(28935)))

img = network.State(res[0]).to_Nifti1Image()
texture = surface.vol_to_surf(img, surf)
fig = plotting.plot_surf_stat_map(surf, texture, bg_map=bg_map, bg_on_data=True, hemi='left', title='lateral', colorbar=False, cmap='coolwarm', threshold=0)
fig = plotting.plot_surf_stat_map(surf, texture, bg_map=bg_map, bg_on_data=True, hemi='right', title='medial', colorbar=False, cmap='coolwarm', threshold=0)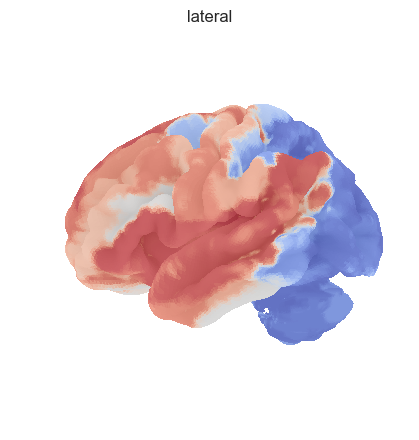
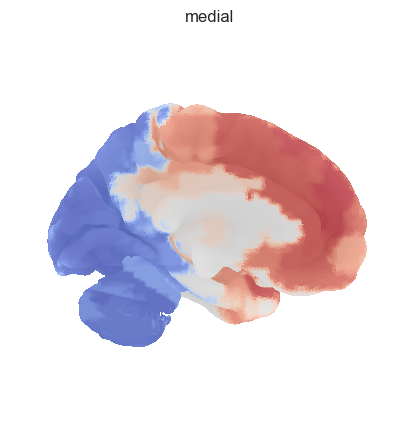
bg_map.shape, surf.coordinates.shape((49419,), (110859, 3))plotting.plot_surf_stat_map(
surf, texture, hemi='left',
title='title', colorbar=True, cmap='coolwarm',
threshold=0)#, bg_map=fsaverage.sulc_left)
from nilearn.image import smooth_img
img = network.State(res[0]).to_Nifti1Image()
# plot surface
from nilearn import plotting
fig, axes = plotting.plot_img_on_surf(img, surf_mesh=s, threshold=0, inflate=False,
                           cmap='coolwarm', bg_on_data=True, alpha=1)
---------------------------------------------------------------------------
ValueError Traceback (most recent call last)
Cell In[113], line 5
3 # plot surface
4 from nilearn import plotting
----> 5 fig, axes = plotting.plot_img_on_surf(img, surf_mesh=s, threshold=0, inflate=False,
6 cmap='coolwarm', bg_on_data=True, alpha=1)
File ~/src/ghost-in-the-machine/venv/lib/python3.9/site-packages/nilearn/plotting/surf_plotting.py:1454, in plot_img_on_surf(stat_map, surf_mesh, mask_img, hemispheres, bg_on_data, inflate, views, output_file, title, colorbar, vmin, vmax, threshold, symmetric_cbar, cmap, cbar_tick_format, **kwargs)
1452 modes = _check_views(views)
1453 hemis = _check_hemispheres(hemispheres)
-> 1454 surf_mesh = check_mesh(surf_mesh)
1456 mesh_prefix = "infl" if inflate else "pial"
1457 surf = {
1458 'left': surf_mesh[f'{mesh_prefix}_left'],
1459 'right': surf_mesh[f'{mesh_prefix}_right'],
1460 }
File ~/src/ghost-in-the-machine/venv/lib/python3.9/site-packages/nilearn/surface/surface.py:1010, in check_mesh(mesh)
1007 missing = {'pial_left', 'pial_right', 'sulc_left', 'sulc_right',
1008 'infl_left', 'infl_right'}.difference(mesh.keys())
1009 if missing:
-> 1010 raise ValueError(
1011 f"{missing} {'are' if len(missing) > 1 else 'is'} "
1012 "missing from the provided mesh dictionary")
1013 return mesh
ValueError: {'pial_left', 'sulc_left', 'pial_right', 'infl_left', 'sulc_right', 'infl_right'} are missing from the provided mesh dictionarynetwork.Hopfield(J).plot_weights()
plt.show()
network.Hopfield(J2).plot_weights()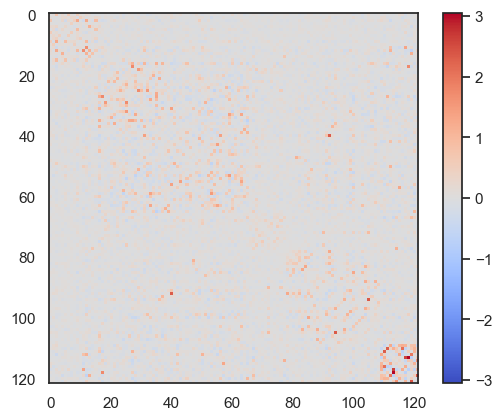
<matplotlib.image.AxesImage at 0x35f3e0910>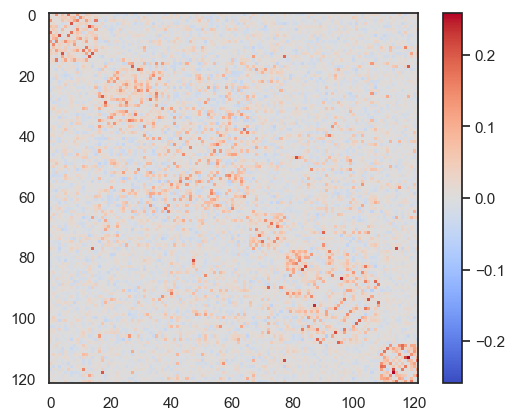
def compute_W_from_J(J, num_attractors=None):
    if num_attractors is None:
        num_attractors = J.shape[0]
    # Eigenvalue decomposition of J
    eigenvalues, eigenvectors = np.linalg.eigh(J)
    # Sort eigenvalues and corresponding eigenvectors in descending order
    idx = np.argsort(eigenvalues)[::-1]
    eigenvalues = eigenvalues[idx]
    eigenvectors = eigenvectors[:, idx]
    # Select the first `num_hidden_nodes` eigenvalues and eigenvectors
    selected_eigenvalues = eigenvalues[:num_attractors]
    selected_eigenvectors = eigenvectors[:, :num_attractors]
    # Compute the weight matrix W
    W = selected_eigenvectors * np.sqrt(-selected_eigenvalues)

    print(np.sqrt(-selected_eigenvalues))
    return W

x =compute_W_from_J(J, 5)
[0.50262855 1.01528971 1.07331623 1.16959446 1.23740527]
- Englert, R., Kincses, B., Kotikalapudi, R., Gallitto, G., Li, J., Hoffschlag, K., Woo, C.-W., Wager, T. D., Timmann, D., Bingel, U., & Spisak, T. (2023). Connectome-Based Attractor Dynamics Underlie Brain Activity in Rest, Task, and Disease. 10.1101/2023.11.03.565516