Analysis Code: Replication Analysis
- for reconstructing the attracrtor landscape based on resting state fMRI data -
import numpy as np
import seaborn as sns
from matplotlib import pyplot as plt
import scipy.integrate as integrate

sns.set(style="white")
import os
from glob import glob
import pandas as pd
from sklearn.preprocessing import StandardScaler
Load regional BOLD fMRI timeseries data
See {cite:p}‘Englert et al. (2023)’ for details. Here we replicate the results on a different dataset, by changing the file name from ‘essen-.tsv’ to 'bochum-.tsv’
# load Essen timeseries data and scrub resting state data
_fd_thr = 0.15
_perc_scrub_thr = 0.5
all_ts = []
root_dir = 'data/ex_timeseries/'
for f in glob(root_dir + 'bochum-*.tsv'):  # changed to bochum-*.tsv for replication with the Bochum dataset
    path, filename = os.path.split(f)
    ts = pd.read_csv(f, sep='\t').iloc[:, 1:].values
    ts = StandardScaler().fit_transform(ts)
    fd = pd.read_csv(path + '/FD_' + os.path.splitext(filename)[0] + '.txt', sep=',').values.flatten()
    fd = np.hstack(([0], fd))
    if np.sum(fd>_fd_thr)/len(fd) < _perc_scrub_thr:
        all_ts.append(ts[fd<_fd_thr])
    else:
        print('perc. scrubbed:', np.sum(fd>_fd_thr)/len(fd))
len(all_ts)
perc. scrubbed: 0.515
40Reconstructing attractors: computational approach
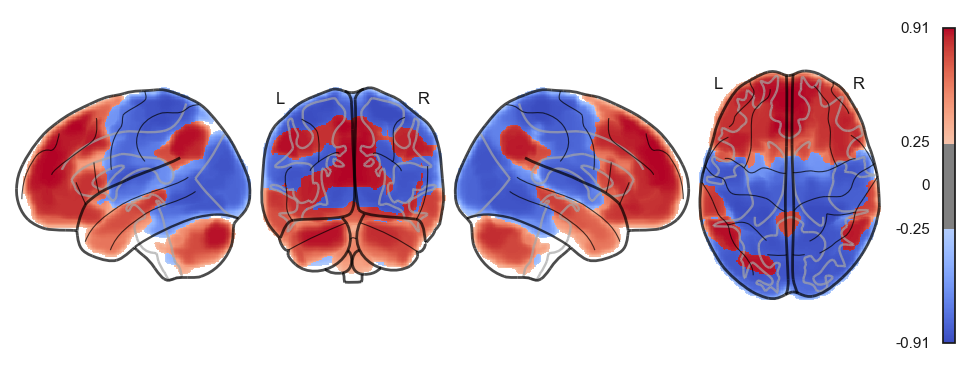
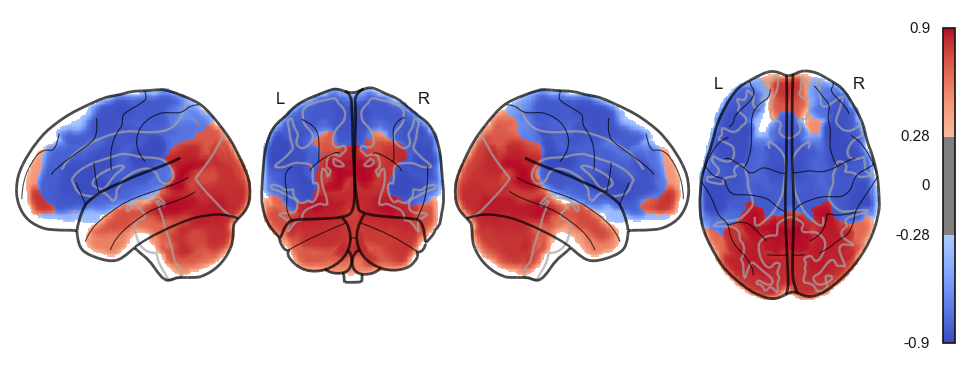
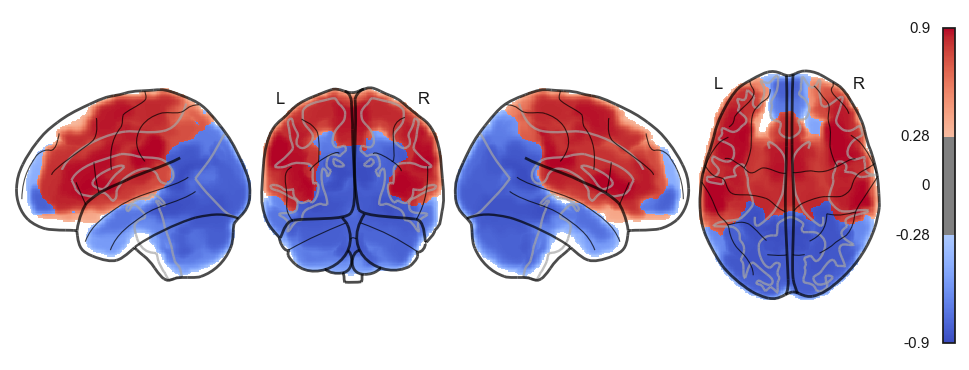
We use the connattractor package Englert et al., 2023 to constrcut a functional connectome-based continuous-space Hopfield network (fcHNN) and identify its attractors by relaxong the network with randomly sampled input states. Unlike for the analytical approach, here we have to set all biases to zero.
from connattractor import network
from nilearn.connectome import ConnectivityMeasure
# fcHNN solution
correlation_measure = ConnectivityMeasure(kind='partial correlation',  vectorize=False, discard_diagonal=False) # uses Ledoit-Wolf estimator
correlation_measure.fit_transform(all_ts)
parcor = 1 * correlation_measure.mean_
hopnet = network.Hopfield(parcor)
hopnet.W = (parcor-np.mean(parcor))/np.std(parcor) # overwrite the weights to put back the diagonal
attractors = {}
rng = np.random.default_rng(42)
for i in range(100):
    res = hopnet.update(np.tanh(rng.normal(0,1,122)), threshold=0, beta=0.071, num_iter=10000)
    if res[1]<10000: # converged
        state = tuple(np.round(res[0], 6))
        if state not in attractors.keys():
            attractors[state] = 1
        else:
            attractors[state] += 1

attractors_fchnn = sorted(attractors.items(), key=lambda item: item[1])[::-1]
len(attractors_fchnn)10Plot the attractros
attractor_states_fchnn = np.array([k for i, (k, v) in enumerate(attractors_fchnn)])
for i in range(attractor_states_fchnn.shape[0]):
    network.State(attractor_states_fchnn[i]).plot()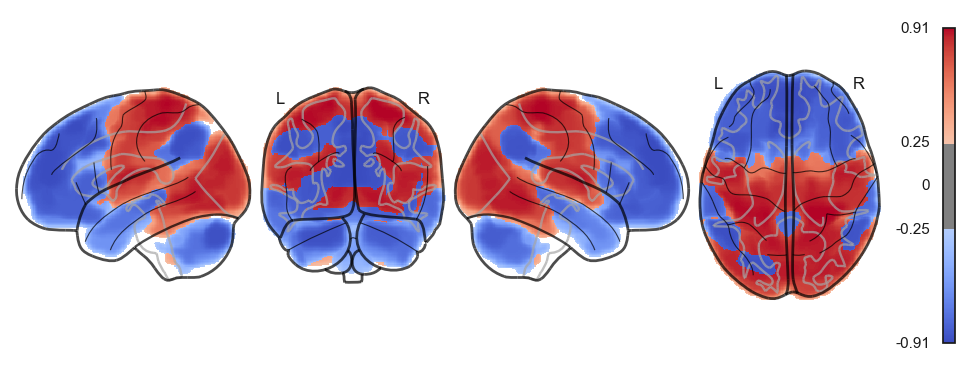
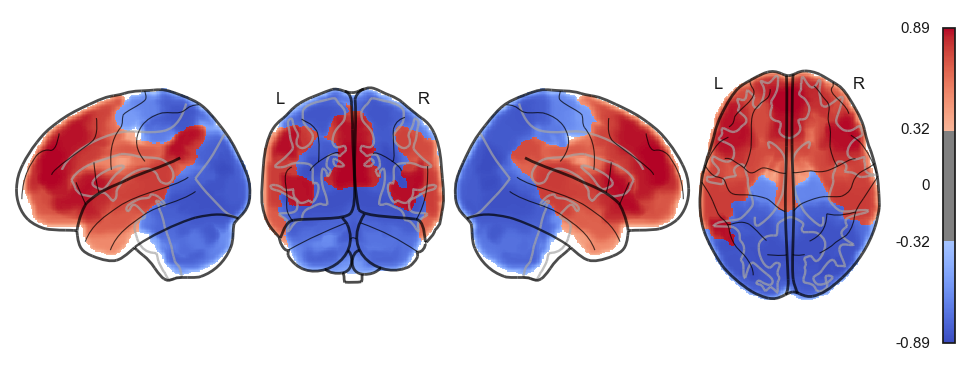
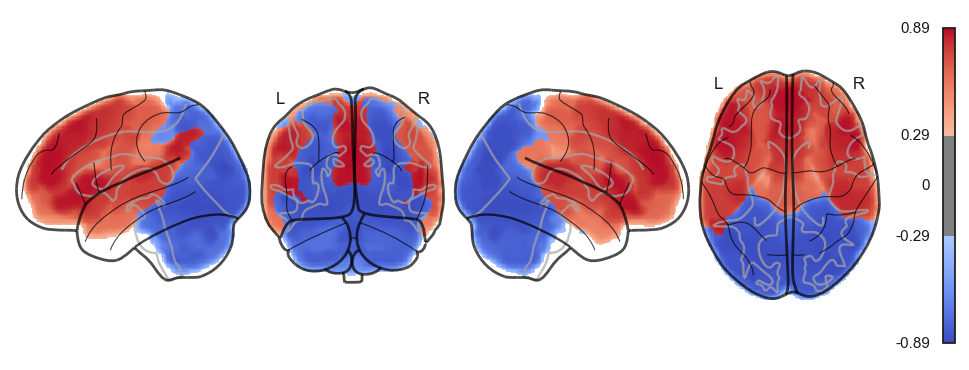
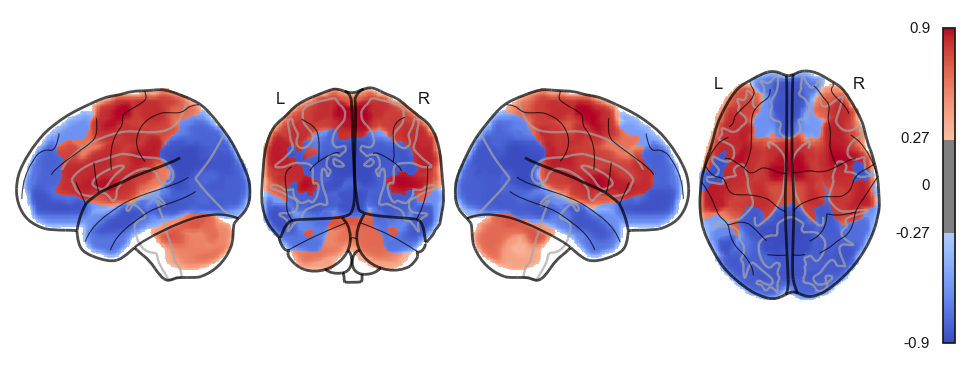
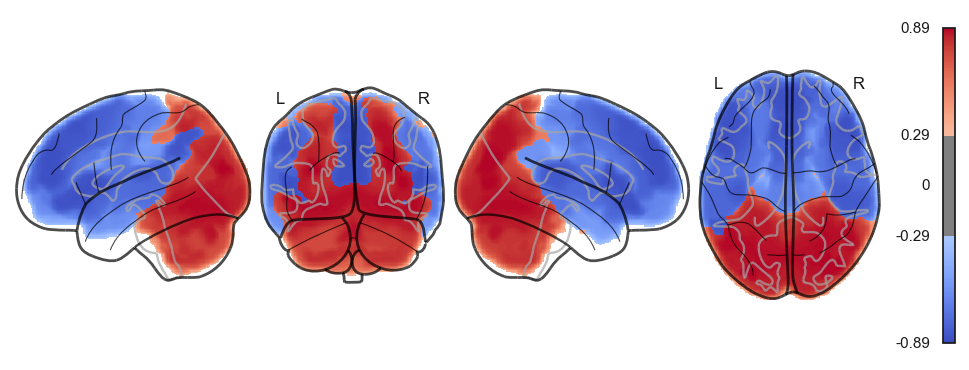
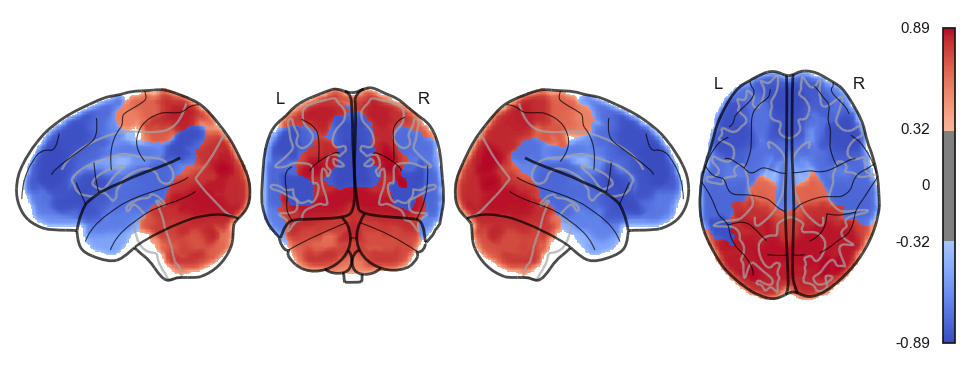
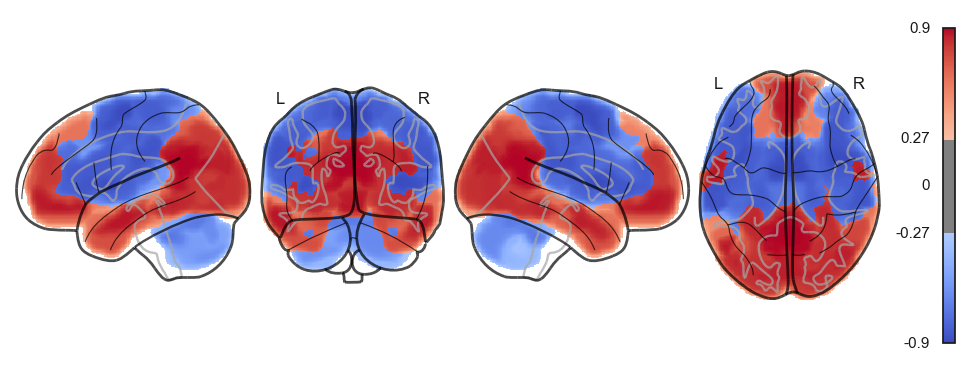
Attractor frequencies
for i, (k, v) in enumerate(attractors_fchnn):
    print(i, v)
0 27
1 23
2 20
3 11
4 5
5 4
6 4
7 2
8 2
9 2
Reconstructing attractors: analytical approach
# comopute the negative precision matrix via nilearn
from nilearn.connectome import ConnectivityMeasure
correlation_measure = ConnectivityMeasure(kind='precision',  vectorize=False, discard_diagonal=False) # uses Ledoit-Wolf estimator
correlation_measure.fit_transform(all_ts)
J = -1 * correlation_measure.mean_
def compute_W_from_J(J, num_attractors=None):
if num_attractors is None:
num_attractors = J.shape[0]
# Eigenvalue decomposition of J
eigenvalues, eigenvectors = np.linalg.eigh(J)
# Sort eigenvalues and corresponding eigenvectors in descending order
idx = np.argsort(eigenvalues)[::-1]
eigenvalues = eigenvalues[idx]
eigenvectors = eigenvectors[:, idx]
# Select the first `num_hidden_nodes` eigenvalues and eigenvectors
selected_eigenvalues = eigenvalues[:num_attractors]
selected_eigenvectors = eigenvectors[:, :num_attractors]
# Compute the weight matrix W
W = selected_eigenvectors * np.sqrt(-selected_eigenvalues)
return Wfrom connattractor import network
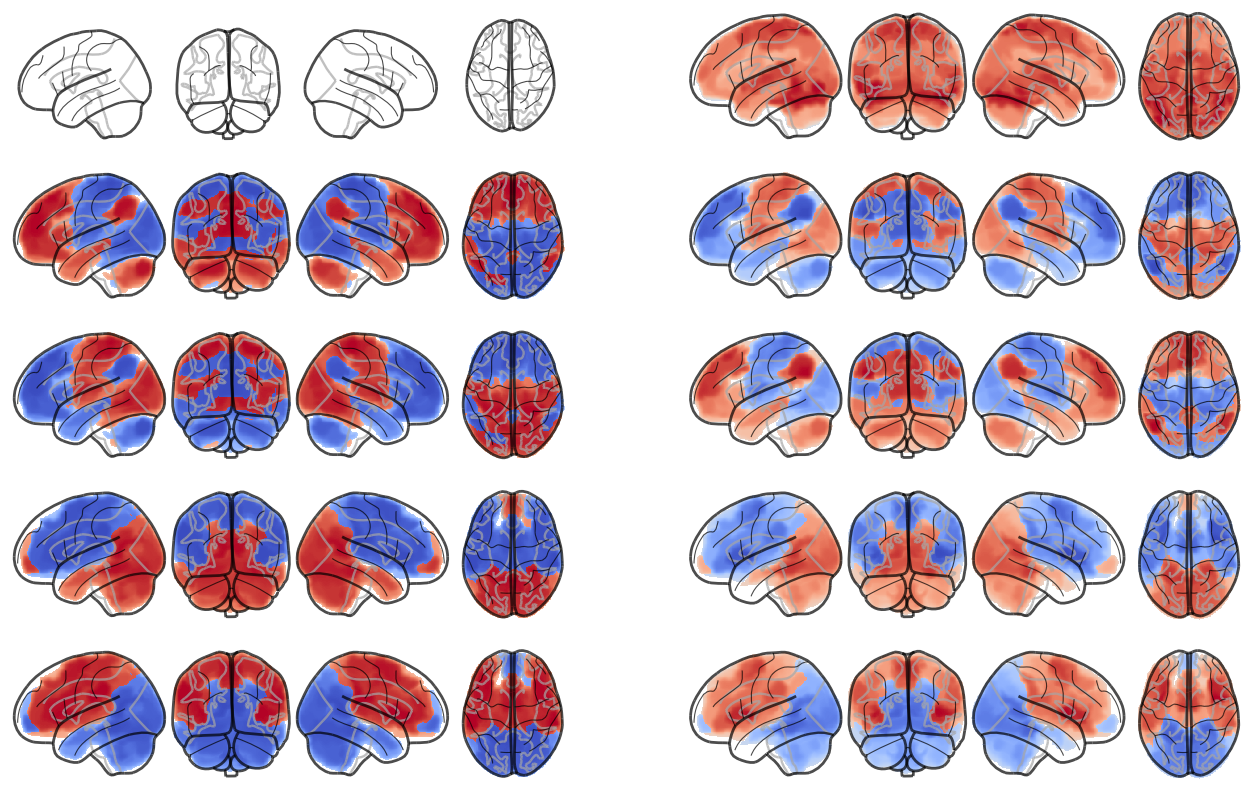
num_attractors = 5
# analytical solution
W = compute_W_from_J(J, num_attractors = num_attractors)
# fcHNN solution already stored in attractors_fchnn
# we change the order to match the analytical solution
attractor_states_fchnn = np.array([k for i, (k, v) in enumerate(attractors_fchnn)])
indices = [None, 1, 0, 2, 3]
fig, axs = plt.subplots(ncols=2, nrows=num_attractors, figsize=(16, 2*num_attractors))
for i in range(num_attractors):
print(i)
if i == 0:
network.State(np.zeros(122)).plot(plot_abs=False, figure=fig, axes=axs[i, 0], annotate=False, colorbar=False)
state_analytic = network.State(-1*W[:,i]) # *-1 for visualization
state_analytic.plot(plot_abs=False, figure=fig, axes=axs[i, 1], annotate=False, colorbar=False)
else:
network.State(attractor_states_fchnn[indices[i]]).plot(plot_abs=False, figure=fig, axes=axs[i, 0], annotate=False, colorbar=False)
if i % 2 == 0:
state_analytic = network.State(W[:,int((i+1)/2)]) # original
state_analytic.plot(plot_abs=False, figure=fig, axes=axs[i, 1], annotate=False, colorbar=False)
else:
state_analytic = network.State(-1*W[:,int((i+1)/2)]) # inverse
state_analytic.plot(plot_abs=False, figure=fig, axes=axs[i, 1], annotate=False, colorbar=False)
plt.show()0
/Users/tspisak/src/ghost-in-the-machine/venv/lib/python3.9/site-packages/nilearn/plotting/displays/_slicers.py:308: UserWarning: empty mask
  ims = self._map_show(img, type="imshow", threshold=threshold, **kwargs)
1
2
3
4
from connattractor import network

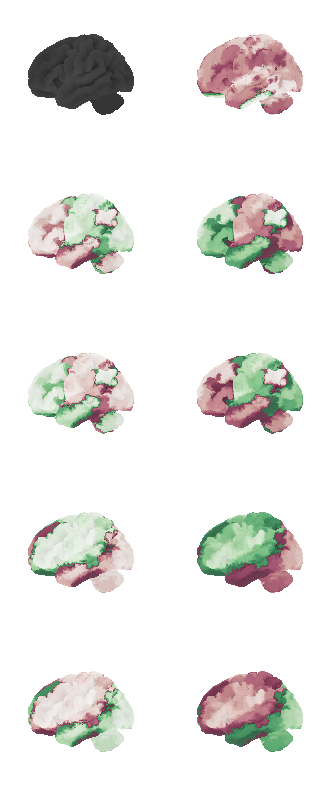
num_attractors = 5

from nilearn import surface, plotting, datasets
fsaverage = datasets.fetch_surf_fsaverage('fsaverage6')
surf = surface.load_surf_mesh('data/full_brain_left.surf.gii')
bg_map = np.hstack((surface.load_surf_data(fsaverage.sulc_left),
                    np.zeros(28935))) # magic number: number of cerebellum vertices (SUIT cerebellum template)

# analytical solution
W = compute_W_from_J(J, num_attractors = num_attractors)

# fcHNN solution already stored in attractors_fchnn
# we change the order to match the analytical solution
attractor_states_fchnn = np.array([k for i, (k, v) in enumerate(attractors_fchnn)])
indices = [None, 1, 0, 2, 3]

fig, axs = plt.subplots(ncols=2, nrows=num_attractors, figsize=(4, 2*num_attractors), subplot_kw={'projection': '3d'})
for i in range(num_attractors):
    print(i)
    if i == 0:
        network.State(np.ones(122)).plot(plot_abs=False, figure=fig, axes=axs[i, 0], annotate=False, colorbar=False)

        texture = np.zeros(surf.coordinates.shape[0])
        fig = plotting.plot_surf_stat_map(surf, texture, bg_map=bg_map, bg_on_data=True, hemi='left', colorbar=False, cmap='purple_green_r', threshold=0, figure=fig, axes=axs[i, 0])

        img = network.State(-1*W[:,i]).to_Nifti1Image()
        texture = surface.vol_to_surf(img, surf)
        fig = plotting.plot_surf_stat_map(surf, texture, bg_map=bg_map, bg_on_data=True, hemi='left', colorbar=False, cmap='purple_green_r', threshold=0, figure=fig, axes=axs[i, 1])

    else:
        img = network.State(attractor_states_fchnn[indices[i]]).to_Nifti1Image()
        texture = surface.vol_to_surf(img, surf)
        fig = plotting.plot_surf_stat_map(surf, texture, bg_map=bg_map, bg_on_data=True, hemi='left', colorbar=False, cmap='purple_green_r', threshold=0, figure=fig, axes=axs[i, 0])

        if i % 2 == 0:
            img = network.State(W[:,int((i+1)/2)]).to_Nifti1Image()
            texture = surface.vol_to_surf(img, surf)
            fig = plotting.plot_surf_stat_map(surf, texture, bg_map=bg_map, bg_on_data=True, hemi='left', colorbar=False, cmap='purple_green_r', threshold=0, figure=fig, axes=axs[i, 1])
        else:

            img = network.State(-1*W[:,int((i+1)/2)]).to_Nifti1Image()
            texture = surface.vol_to_surf(img, surf)
            fig = plotting.plot_surf_stat_map(surf, texture, bg_map=bg_map, bg_on_data=True, hemi='left', colorbar=False, cmap='purple_green_r', threshold=0, figure=fig, axes=axs[i, 1])
plt.show()
0
/Users/tspisak/src/ghost-in-the-machine/venv/lib/python3.9/site-packages/nilearn/plotting/surf_plotting.py:522: RuntimeWarning: invalid value encountered in divide
  data_copy /= (vmax - vmin)
1
2
3
4
from connattractor import network

num_attractors = 14

from nilearn import surface, plotting, datasets
fsaverage = datasets.fetch_surf_fsaverage('fsaverage6')
surf = surface.load_surf_mesh('data/full_brain_left.surf.gii')
bg_map = np.hstack((surface.load_surf_data(fsaverage.sulc_left),
                    np.zeros(28935))) # magic number: number of cerebellum vertices (SUIT cerebellum template)

# analytical solution
W = compute_W_from_J(J, num_attractors = num_attractors)

# fcHNN solution already stored in attractors_fchnn
# we change the order to match the analytical solution
attractor_states_fchnn = np.array([k for i, (k, v) in enumerate(attractors_fchnn)])

fig, axs = plt.subplots(ncols=2, nrows=num_attractors, figsize=(4, 2*num_attractors), subplot_kw={'projection': '3d'})

for i in range(0,num_attractors):
    print(i)

    # cmap: PiYG, cyan_orange, cold_hot, blue_red

    if i % 2 == 0:
        img = network.State(W[:,int((i)/2)]).to_Nifti1Image()
        img.to_filename(f'data/attractor_{int((i)/2)}_pos.nii.gz')
        texture = surface.vol_to_surf(img, surf)
        #texture[texture<0] = 0
        fig = plotting.plot_surf_stat_map(surf, texture, bg_map=bg_map, bg_on_data=False, hemi='left', colorbar=False, cmap='PiYG', threshold=0, figure=fig, axes=axs[i, 0], symmetric_cbar=True, vmin=-0.2, vmax=0.2, darkness=1)
        fig = plotting.plot_surf_stat_map(surf, texture, bg_map=bg_map, bg_on_data=False, hemi='right', colorbar=False, cmap='PiYG', threshold=0, figure=fig, axes=axs[i, 1], symmetric_cbar=True, vmin=-0.2, vmax=0.2, darkness=1)
    else:
        img = network.State(-1*W[:,int((i)/2)]).to_Nifti1Image()
        img.to_filename(f'data/attractor_{int((i)/2)}_neg.nii.gz')
        texture = surface.vol_to_surf(img, surf)
        #texture[texture<0] = 0
        fig = plotting.plot_surf_stat_map(surf, texture, bg_map=bg_map, bg_on_data=False, hemi='left', colorbar=False, cmap='PiYG', threshold=0, figure=fig, axes=axs[i, 0], symmetric_cbar=True, vmin=-0.25, vmax=0.25, darkness=1)
        fig = plotting.plot_surf_stat_map(surf, texture, bg_map=bg_map, bg_on_data=False, hemi='right', colorbar=False, cmap='PiYG', threshold=0, figure=fig, axes=axs[i, 1], symmetric_cbar=True, vmin=-0.25, vmax=0.25, darkness=1)
plt.show()
0
1
2
3
4
5
6
7
8
9
10
11
12
13

    from nilearn import surface, plotting, datasets
    fsaverage = datasets.fetch_surf_fsaverage('fsaverage6')
    surf = surface.load_surf_mesh('data/full_brain_left.surf.gii')
    bg_map = np.hstack((surface.load_surf_data(fsaverage.sulc_left),
                        np.zeros(28935))) # magic number: number of cerebellum vertices (SUIT cerebellum template)
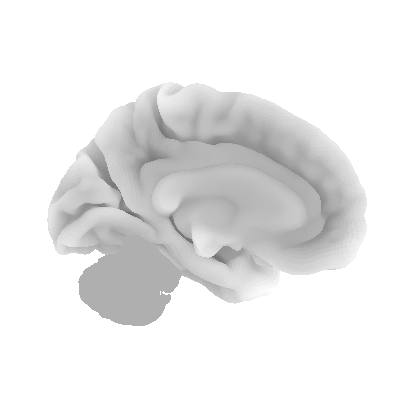
    # plot control signal
    signal = np.zeros(122)
    img = network.State(signal).to_Nifti1Image()
    # due to numerical instabilities, the sign may flips, we flip ti back by np.sign(W[0,i])
    texture = surface.vol_to_surf(img, surf)
    fig = plotting.plot_surf_stat_map(surf, texture, bg_map=bg_map, bg_on_data=True, hemi='right', colorbar=False, cmap='coolwarm', threshold=0.2)
/Users/tspisak/src/ghost-in-the-machine/venv/lib/python3.9/site-packages/nilearn/plotting/surf_plotting.py:522: RuntimeWarning: invalid value encountered in divide
data_copy /= (vmax - vmin)
mist_regions = pd.read_csv('data/MIST122_relabeled.tsv', sep='\t')
mist_regions.columns = ['label', 'MIST_index', 'region', 'module']
mist_mapper=mist_regions[['label', 'region']]
mist_mapper.set_index('region', inplace=True)
mist_mapper.loc['CER6_p', 'label']
mist_regions
Loading...
# top 5 positive and negative weights for all attractors
num_attractors = 6
W = compute_W_from_J(J, num_attractors=num_attractors)
for i in range(num_attractors):
    print(f'Attractor {i}')
    print('Positive weights:')
    positive_indices = np.argsort(W[:, i])[::-1][:10]
    for idx in positive_indices:
        region = mist_mapper.loc[mist_mapper['label'] == idx+1].index[0]
        weight = W[idx, i]
        print(f'{region}: {weight}')

    print('Negative weights:')
    negative_indices = np.argsort(W[:, i])[:10]
    for idx in negative_indices:
        region = mist_mapper.loc[mist_mapper['label'] == idx+1].index[0]
        weight = W[idx, i]
        print(f'{region}: {weight}')
Attractor 0
Positive weights:
CER9_v: -0.0045697193688509306
CER7b_l: -0.022564042103674336
CER9_m: -0.0312400511652437
MORBgyr: -0.03264382343688
THAL_v: -0.03621428305872353
CAUDNH_NACC: -0.03677707806347359
CAUDN_d: -0.037117304494786785
CER7b_m: -0.03756792513887191
CER9_d: -0.037712575290940104
CAUDN_v: -0.037930088566299085
Negative weights:
PRC_d: -0.06655287573521601
LVISnet_vp: -0.06592787799143819
OCCTgyr_l: -0.06532554393387485
CERCR1: -0.0650805892064828
MOTnet_ml: -0.06317555094693857
STgyr_m: -0.06301544117943406
SPlob: -0.062067892962386274
PCsul_d: -0.06143755242764257
PSMcor_a: -0.061400506131860884
VVISnet_m: -0.06098846893881961
Attractor 1
Positive weights:
L_IPlob: 0.207443569634894
SFgyr_ad: 0.1982101873091965
L_IPlob: 0.19433560394902077
R_IPlob: 0.19174560534645765
DMPFC_ar: 0.18978511193580166
DMPFcor_ac: 0.1834258204528352
L_MFgyr_pr: 0.17644985781128353
L_SFsul_a: 0.1741972762352281
PCcor: 0.15692587366533337
L_CERCR2_p: 0.15342217806687064
Negative weights:
PCsul_d: -0.17840157757219446
PINS_d: -0.17110966588182988
MOTnet_ml: -0.15402535757353084
MOTnet_am: -0.15361802655835605
R_MOTnet_dl: -0.15361044191224324
MVISnet_av: -0.15055460347772112
L_MOTnet_dl: -0.14883114853646573
MOTnet_l: -0.1423992784794897
MOTnet_m: -0.14148880750824183
SPlob: -0.14026117610792552
Attractor 2
Positive weights:
AINS_pd: 0.22580597282715237
AINS_ad: 0.21082634161846808
PSMcor_p: 0.19627890199799597
SMgyr: 0.18021962293043498
L_VLPFcor: 0.17337203530787065
R_VLPFcor: 0.17024084224052563
PSMcor_a: 0.16888819090744456
CNGsul_p: 0.16797417129442688
PINS_d: 0.161275744829122
L_MFgyr_pc: 0.1590622301054669
Negative weights:
POsul_v: -0.2021281304231466
COLsul: -0.2002062914068079
POsul: -0.19046695516270837
VVISnet_m: -0.18048167817556243
VVISnet_l: -0.17697090698128698
PVISnet_vm: -0.17242037631927914
PVISnet_l: -0.16830339122860627
PVISnet_dm: -0.16288475596478344
MVISnet_av: -0.1583204565314855
HIPP: -0.15822541504097698
Attractor 3
Positive weights:
VMPFcor_p: 0.2995693350974381
PGACcor: 0.28509846012771756
POsul: 0.2607951669012303
PRC_v: 0.2481314360588701
VMPFcor_a: 0.2326899917946856
DMPFcor_ac: 0.22825940959808394
POsul_v: 0.2235325501251476
HSgyr: 0.1936852203432608
HIPP: 0.1913720710193629
PCcor: 0.18224723621885947
Negative weights:
R_CERCR2_p: -0.24713765155651715
CER7b_m: -0.24142640333778184
L_IPsul: -0.22421766204996307
CERCR1: -0.2226937705122851
L_CERCR2_p: -0.21973170793730945
L_CERCR2_a: -0.21585427403013996
L_IFsul: -0.2079219452972102
CER6_p: -0.20518286625717727
R_CERCR2_a: -0.1986553002741666
R_PORB: -0.1919081313699482
Attractor 4
Positive weights:
CER9_d: 0.3218343248018716
CER6_p: 0.29442966625828015
CER6_d: 0.28208435315898195
CER5: 0.2578596412636508
CER9_m: 0.2456493369197581
CER6_a: 0.24403899935058274
L_CERCR2_p: 0.232726458160305
PUT_a: 0.22750407087025115
R_CERCR2_p: 0.21539012118298975
PUT_p: 0.20345031434260874
Negative weights:
L_IPsul: -0.2511529661115722
L_DVIS_v: -0.2507954073924514
R_DVIS_v: -0.23880775549146424
POsul_d: -0.21717814176512468
DVIS_s: -0.20722374859220632
DVIS_vl: -0.20080819306247807
R_IPsul: -0.20080812353559685
L_IPlob: -0.19533557154394918
PRC_d: -0.18660580049503755
R_PCsul: -0.1778857091904581
Attractor 5
Positive weights:
L_VLPFcor: 0.398903850301952
L_MTgyr_p: 0.35416431898926665
L_MTgyr_a: 0.33451105366110584
TP: 0.2699719308418202
L_ANGgyr: 0.21514011498121619
SFgyr_ad: 0.2053662272399248
L_MFgyr_pr: 0.19959281670376133
L_IPlob: 0.1987454644510717
L_MFgyr_pc: 0.1979946371007426
STgyr_a: 0.19120296691369099
Negative weights:
POsul_d: -0.3330486016965695
R_IPsul: -0.30555487284621685
PCcor: -0.293527423856837
R_SFsul: -0.2918767269629362
R_DVIS_v: -0.26863984267217816
R_MFgyr_a: -0.2612352286966247
PRC_d: -0.24783656820925823
ACcor_d: -0.24645490027653094
IMsul: -0.23856175873260893
POsul: -0.21936495252237603
W = compute_W_from_J(J, num_attractors=12)
# do tsne on the weights
from sklearn.manifold import TSNE
tsne = TSNE(n_components=2, perplexity=5, random_state=42)
W_tsne = tsne.fit_transform(W)
#plot it
plt.figure(figsize=(6,6))
plt.scatter(W_tsne[:,0], W_tsne[:,1], alpha=0.5)
# add labels
for i, txt in enumerate(range(1, len(W_tsne))):
    plt.annotate(mist_regions.iloc[i-1, 2], (W_tsne[i,0], W_tsne[i,1]), fontsize=6)
plt.show()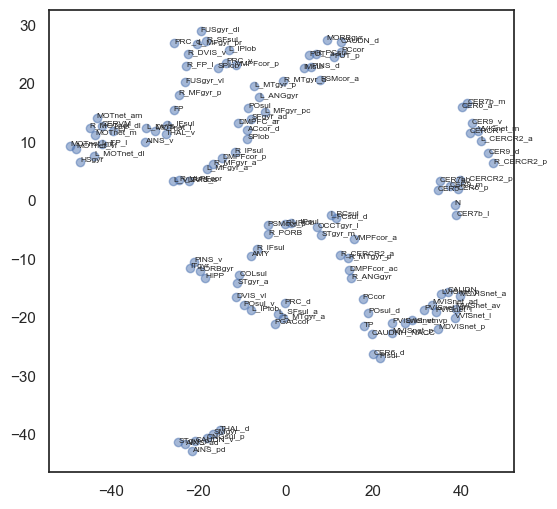
attractor_states_fchnn.shape(10, 122)def hn_energy(state, threshold):
return -0.5 * state @ J @ state + state @ threshold
def plot_manifold(num_attractors = 6, perplexity=None, smooth_sigma=0.8, filename=None):
from openTSNE import TSNE
W = compute_W_from_J(J, num_attractors=num_attractors)
if perplexity is None:
perplexity = (num_attractors+1)/3
W_paired = []
for i in range(0, num_attractors):
W_paired.append(W[:,i])
W_paired.append(-W[:,i])
W_paired = np.array(W_paired).T
#W_paired = attractor_states_fchnn.T
# do tsne on the weights
tsne = TSNE(n_components=2, perplexity=perplexity, initialization='pca', metric="euclidean", random_state=42, n_jobs=16)
tsne_embedding = tsne.fit(W_paired.transpose())
W_tsne = tsne_embedding[:num_attractors*2,:]
W_paired = W_paired[:,:num_attractors*2]
#transform sample
sample = np.vstack(all_ts)
sample_tsne = tsne_embedding.transform(sample, perplexity=perplexity)
from scipy.stats import binned_statistic_2d
energies = np.array([hn_energy(sample[i], np.zeros(J.shape[0])) for i in range(sample.shape[0])])
mean_energy = binned_statistic_2d(sample_tsne[:,0], sample_tsne[:,1], values=energies, statistic='mean', bins=20)
# smooth ean_energy.statistic
from scipy.ndimage import gaussian_filter
mean_energy_smoothed = np.copy(mean_energy.statistic)
grand_mean = np.mean(mean_energy_smoothed[~ np.isnan(mean_energy_smoothed)])
mean_energy_smoothed[np.isnan(mean_energy_smoothed)] = grand_mean # mean inputting
mean_energy_smoothed = gaussian_filter(mean_energy_smoothed, sigma=smooth_sigma)
mean_energy_smoothed_nan = mean_energy_smoothed.copy()
mean_energy_smoothed_nan[np.isnan(mean_energy.statistic)] = np.nan # write back nan values
# plot
fig, axes = plt.subplots(1, 4, figsize=(16, 4))
attractor_energies = [hn_energy(W_paired[:,i], np.zeros(J.shape[0])) for i in range(W_paired.shape[1])]
##########
sctplt = axes[0].scatter(sample_tsne[:,0], sample_tsne[:,1], alpha=0.5, c=[hn_energy(sample[i], np.zeros(J.shape[0])) for i in range(sample.shape[0])],cmap='coolwarm', s=6, vmin=100, vmax=350, edgecolor='none')
plt.colorbar(sctplt,ax=axes[0], location='bottom', shrink=0.6, ticks=[100, 350])
axes[0].scatter(W_tsne[:,0], W_tsne[:,1], alpha=0.5, c=attractor_energies,cmap='coolwarm', s=30, edgecolors= "black", vmin=100, vmax=350)
##########
sns.kdeplot(x=sample_tsne[:,0], y=sample_tsne[:,1], ax=axes[1], cmap='Greens', cbar=True, fill=True, levels=8, thresh=0.01, alpha=1.0,antialiased=True, cbar_kws={"location":"bottom", "shrink":0.6, "ticks":[0.01, 0.1]})
axes[1].scatter(W_tsne[:,0], W_tsne[:,1], alpha=0.5, c=attractor_energies,
cmap='coolwarm', edgecolors= "black", vmin=200, vmax=280, color=None)
###########
implt = axes[2].imshow(mean_energy_smoothed_nan.transpose(), origin='lower', extent=(sample_tsne[:,0].min(), sample_tsne[:,0].max(), sample_tsne[:,1].min(), sample_tsne[:,1].max()), aspect='auto', cmap='coolwarm', vmin=200, vmax=280,
#interpolation='bicubic'
)
plt.colorbar(implt,ax=axes[2], location='bottom', shrink=0.6, ticks=[200, 280])
axes[2].scatter(W_tsne[:,0], W_tsne[:,1], alpha=0.5, c=attractor_energies,
cmap='coolwarm', edgecolors= "black", vmin=200, vmax=280, s=30)
# set limits
axes[2].set_xlim(sample_tsne[:,0].min()*1.1, sample_tsne[:,0].max()*1.1)
axes[2].set_ylim(sample_tsne[:,1].min()*1.1, sample_tsne[:,1].max()*1.1)
for i, txt in enumerate(range(0, W_tsne.shape[0])):
axes[0].annotate(txt, (W_tsne[i,0], W_tsne[i,1]))
axes[1].annotate(txt, (W_tsne[i,0], W_tsne[i,1]))
axes[2].annotate(txt, (W_tsne[i,0], W_tsne[i,1]))
sns.despine() #left=True, bottom=True)
## Surface plot:
# swap 4th subplot to 3d
axes[3].remove()
axes[3] = fig.add_subplot(1, 4, 4, projection='3d')
# Extracting the necessary information
mean_values = mean_energy_smoothed # The mean energy in each bin
x_edges = mean_energy.x_edge # The edges of the bins in the x direction
y_edges = mean_energy.y_edge # The edges of the bins in the y direction
# Calculate bin centers
x_centers = (x_edges[:-1] + x_edges[1:]) / 2
y_centers = (y_edges[:-1] + y_edges[1:]) / 2
# Create a meshgrid for the surface plot
X, Y = np.meshgrid(x_centers, y_centers)
# Plotting the 3D surface
# Surface plot
for i in range(0, W_tsne.shape[0]):
# search closes point from the meshgrid
x_idx = np.argmin(np.abs(x_centers - W_tsne[i,0]))
y_idx = np.argmin(np.abs(y_centers - W_tsne[i,1]))
#ax.scatter(x_centers[x_idx], y_centers[y_idx], mean_values[x_idx, y_idx], color='black', s=30)
axes[3].plot([x_centers[x_idx], x_centers[x_idx]],
[y_centers[y_idx],y_centers[y_idx]],
zs=[mean_values[x_idx, y_idx]+2, mean_values[x_idx, y_idx]+20], color='black')
surf = axes[3].plot_surface(X, Y, mean_values.T, cmap='coolwarm', linewidth=0.1)
axes[3].set_zlim(200, 280)
axes[3].view_init(elev=50, azim=-70)
# zoom in a bit more
#axes[3].dist = 3
zoom = 0.8
axes[3].set_xlim3d(sample_tsne[:,0].min()*zoom, sample_tsne[:,0].max()*zoom)
axes[3].set_ylim3d(sample_tsne[:,0].min()*zoom, sample_tsne[:,0].max()*zoom)
axes[3].set_zlim3d(100, 350)
# remove axes and everything
axes[3].set_axis_off()
if filename is not None:
plt.savefig(filename)
plt.show()
plot_manifold(num_attractors = 4)
plot_manifold(num_attractors = 5)
plot_manifold(num_attractors = 6, filename='fig/attractor_manifold.pdf')
plot_manifold(num_attractors = 8)
plot_manifold(num_attractors = 10)
plot_manifold(num_attractors = 16)
from connattractor import network
from nilearn import surface, plotting, datasets

fsaverage = datasets.fetch_surf_fsaverage('fsaverage6')
surf = surface.load_surf_mesh('data/full_brain_left.surf.gii')
bg_map = np.hstack((surface.load_surf_data(fsaverage.sulc_left),
                        np.zeros(28935))) # magic number: number of cerebellum vertices (SUIT cerebellum template)

W = compute_W_from_J(J, num_attractors=num_attractors)

num_attractors = 6

W_paired = []
for i in range(0, num_attractors):
     W_paired.append(W[:,i])
     W_paired.append(-W[:,i])
W_paired = np.array(W_paired).T

fig, axes = plt.subplots(nrows=num_attractors*2, ncols=2, figsize=(4, 3*num_attractors), subplot_kw={'projection': '3d'})

for i in range(num_attractors*2):
    img = network.State(W_paired[:,i]).to_Nifti1Image()
    texture = surface.vol_to_surf(img, surf)
    fig = plotting.plot_surf_stat_map(surf, texture, bg_map=bg_map, bg_on_data=True, hemi='left', colorbar=False, cmap='coolwarm', threshold=0, figure=fig, axes=axes[i, 0], title='Attractor {}'.format(i))

    fig = plotting.plot_surf_stat_map(surf, texture, bg_map=bg_map, bg_on_data=True, hemi='right', colorbar=False, cmap='coolwarm', threshold=0, figure=fig, axes=axes[i, 1])

#plt.savefig('fig/attractor_states.pdf')

plt.show()
from connattractor import network
from nilearn import surface, plotting, datasets

fsaverage = datasets.fetch_surf_fsaverage('fsaverage6')
surf = surface.load_surf_mesh('data/full_brain_left.surf.gii')
bg_map = np.hstack((surface.load_surf_data(fsaverage.sulc_left),
                        np.zeros(28935))) # magic number: number of cerebellum vertices (SUIT cerebellum template)

W = compute_W_from_J(J, num_attractors=num_attractors)

num_attractors = 6

W_paired = []
for i in range(0, num_attractors):
     W_paired.append(W[:,i])
     W_paired.append(-W[:,i])
W_paired = np.array(W_paired).T

fig, axes = plt.subplots(nrows=num_attractors*2, ncols=1, figsize=(3, 3*num_attractors))

for i in range(num_attractors*2):
    network.State(W_paired[:,i]).plot(display_mode='x', plot_abs=False, figure=fig, axes=axes[i],
                                      title=str(i), annotate=False, colorbar=False)
#plt.savefig('fig/attractor_states.pdf')

plt.show()

from connattractor import network
# fcHNN solution
correlation_measure = ConnectivityMeasure(kind='partial correlation',  vectorize=False, discard_diagonal=False) # uses Ledoit-Wolf estimator
correlation_measure.fit_transform(all_ts)
parcor = 1 * correlation_measure.mean_
hopnet = network.Hopfield(parcor)
hopnet.W = (parcor-np.mean(parcor))/np.std(parcor) # overwrite the weights to put back the diagonal
attractors = {}
rng = np.random.default_rng(42)
for i in range(1000):
    res = hopnet.update(np.tanh(rng.normal(0,1,122)), threshold=0, beta=0.055, num_iter=10000)
    if res[1]<10000: # converged
        state = tuple(np.round(res[0], 6))
        if state not in attractors.keys():
            attractors[state] = 1
        else:
            attractors[state] += 1

attractors_fchnn = sorted(attractors.items(), key=lambda item: item[1])[::-1]
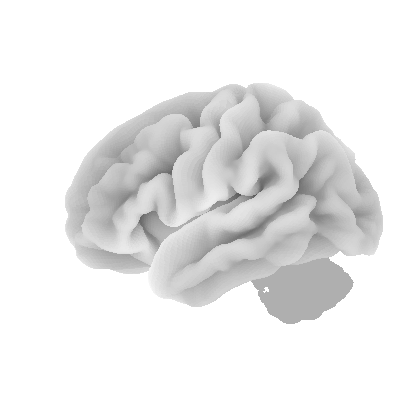
len(attractors_fchnn)4def_control_signals = [1, 2, 1000] #np.logspace(-0.5,0.5,5)
def control_signal_analysis(conrol_sigmal_index, control_signals = def_control_signals, num_attractors = 5):
W_null = compute_W_from_J(J, num_attractors = num_attractors)
from nilearn import surface, plotting, datasets
fsaverage = datasets.fetch_surf_fsaverage('fsaverage6')
surf = surface.load_surf_mesh('data/full_brain_left.surf.gii')
bg_map = np.hstack((surface.load_surf_data(fsaverage.sulc_left),
np.zeros(28935))) # magic number: number of cerebellum vertices (SUIT cerebellum template)
# plot control signal
signal = np.zeros(122)
print(conrol_sigmal_index)
for idx in conrol_sigmal_index:
signal[idx-1] = 1
img = network.State(signal).to_Nifti1Image()
# due to numerical instabilities, the sign may flips, we flip ti back by np.sign(W[0,i])
texture = surface.vol_to_surf(img, surf)
fig = plotting.plot_surf_stat_map(surf, texture, bg_map=bg_map, bg_on_data=True, hemi='left', colorbar=False, cmap='coolwarm', threshold=0.2)
fig, axs = plt.subplots(ncols=len(control_signals), nrows=num_attractors, figsize=(len(control_signals)*2, 2*num_attractors), subplot_kw={'projection': '3d'})
for i in range(num_attractors):
for j, control_signal in enumerate(control_signals):
J_stim = np.copy(J)
for idx in conrol_sigmal_index:
J_stim[idx,idx] *= control_signal
W = compute_W_from_J(J_stim, num_attractors = num_attractors)
if i == 0: # eigencentrality
signflip = -1*np.sign(np.corrcoef(W_null[:,i], W[:,i])[0,1])
img = network.State(signflip*W[:,i]).to_Nifti1Image()
# due to numerical instabilities, the sign may flips, we flip ti back by np.sign(W[0,i])
texture = surface.vol_to_surf(img, surf)
fig = plotting.plot_surf_stat_map(surf, texture, bg_map=bg_map, bg_on_data=True, hemi='left', colorbar=False, cmap='coolwarm', threshold=0, figure=fig, axes=axs[i, j])
else:
signflip = np.sign(np.corrcoef(W_null[:,int((i+1)/2)], W[:,int((i+1)/2)])[0,1])
if i % 2 == 0:
img = network.State(signflip*W[:,int((i+1)/2)]).to_Nifti1Image()
texture = surface.vol_to_surf(img, surf)
fig = plotting.plot_surf_stat_map(surf, texture, bg_map=bg_map, bg_on_data=True, hemi='left', colorbar=False, cmap='coolwarm', threshold=0, figure=fig, axes=axs[i, j])
else:
img = network.State(-1*signflip*W[:,int((i+1)/2)]).to_Nifti1Image()
texture = surface.vol_to_surf(img, surf)
fig = plotting.plot_surf_stat_map(surf, texture, bg_map=bg_map, bg_on_data=True, hemi='left', colorbar=False, cmap='coolwarm', threshold=0, figure=fig, axes=axs[i, j])
plt.show()
mist_mapper.index.values
# see also: https://simexp.github.io/multiscale_dashboard/index.html
array(['CER6_p', 'CER7ab', 'R_CERCR2_p', 'CER9_v', 'CER6_a', 'L_CERCR2_a',
'CER9_d', 'CER9_m', 'CER7b_m', 'L_CERCR2_p', 'CER7b_l', 'N',
'CERCR1', 'CER6_d', 'CER5', 'R_CERCR2_a', 'POsul_d', 'POsul_v',
'VMPFcor_p', 'R_MTgyr_a', 'L_ANGgyr', 'L_MTgyr_p', 'L_MTgyr_a',
'DMPFC_ar', 'L_SFsul_a', 'DMPFcor_ac', 'PCcor', 'POsul', 'L_IPlob',
'PGACcor', 'VMPFcor_a', 'PRC_d', 'SFgyr_ad', 'L_IPlob', 'R_ANGgyr',
'PRC_v', 'R_MTgyr_p', 'PRC_d', 'R_MFgyr_a', 'L_DVIS_v', 'SPlob',
'R_VLPFcor', 'FUSgyr_vl', 'R_IFsul', 'FP', 'R_DVIS_v', 'L_FP_l',
'SPlob', 'L_MFgyr_pc', 'L_VLPFcor', 'OCCTgyr_l', 'ACcor_d',
'L_MFgyr_pr', 'R_MFgyr_p', 'R_IPsul', 'L_IFsul', 'DVIS_s',
'FUSgyr_dl', 'R_SFsul', 'R_IPlob', 'R_FP_l', 'R_PORB', 'DMPFcor_p',
'L_IPsul', 'L_MFgyr_a', 'DVIS_vl', 'CAUDNH_NACC', 'COLsul',
'LORBgyr', 'ITgyr', 'STgyr_a', 'MORBgyr', 'PINS_v', 'TP', 'HIPP',
'AMY', 'PIsul', 'CERVM', 'L_MOTnet_dl', 'MOTnet_am', 'R_MOTnet_dl',
'MOTnet_m', 'MOTnet_ml', 'MOTnet_vl', 'MOTnet_l', 'l_PCsul',
'CNGsul_p', 'PUT_p', 'AINS_pd', 'CAUDN_d', 'AINS_v', 'FEF',
'PCsul_d', 'IMsul', 'STgyr_p', 'CAUDN_v', 'PUT_a', 'HSgyr',
'PSMcor_p', 'PSMcor_a', 'SMgyr', 'THAL_d', 'THAL_v', 'R_PCsul',
'PINS_d', 'STgyr_m', 'PCcor', 'AINS_ad', 'CAUDN', 'PVISnet_l',
'MDVISnet_p', 'MDVISnet_a', 'LVISnet_vp', 'MVISnet_p',
'MVISnet_av', 'LVISnet_p', 'PVISnet_dm', 'PVISnet_vm',
'MVISnet_ad', 'VVISnet_l', 'LVISnet_DP', 'VVISnet_m'], dtype=object)control_signal_analysis(mist_mapper.loc[['AMY'], 'label'].values)[76]
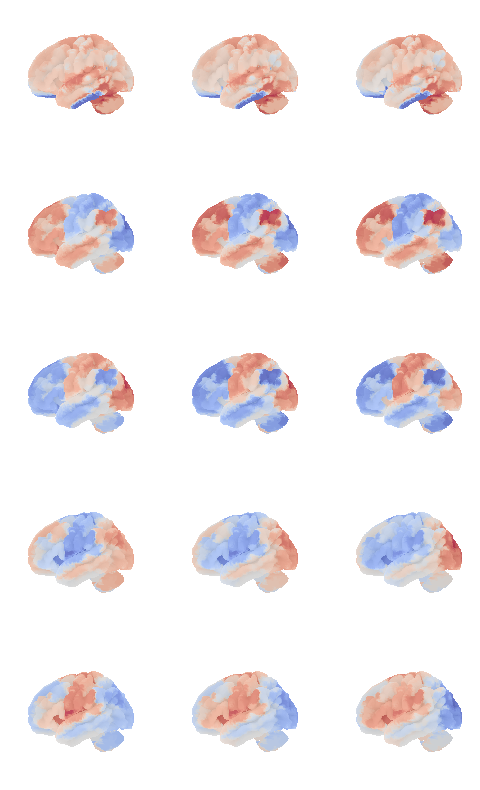
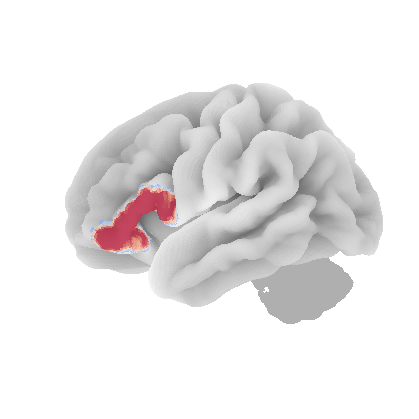
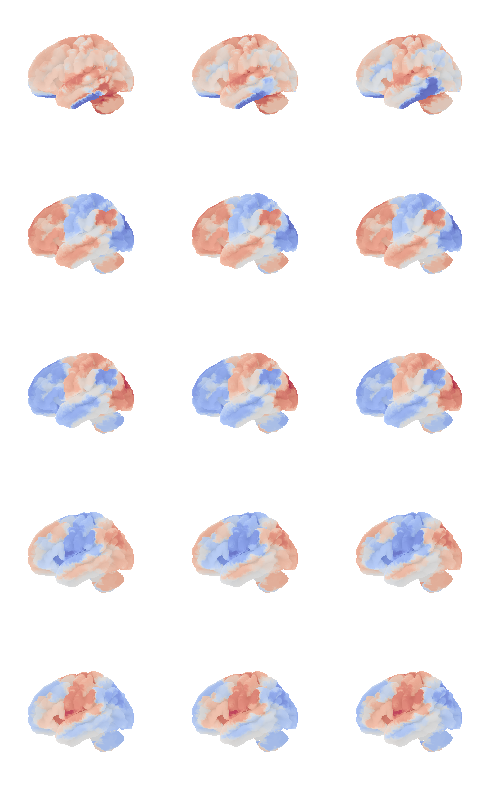
control_signal_analysis(mist_mapper.loc[['L_VLPFcor'], 'label'].values)[50]
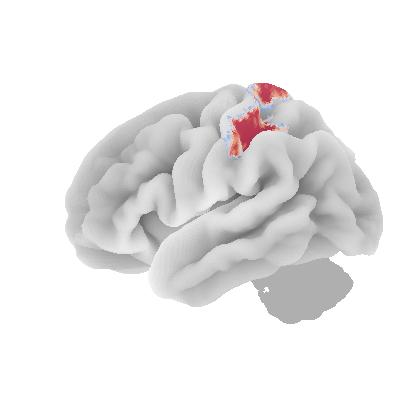
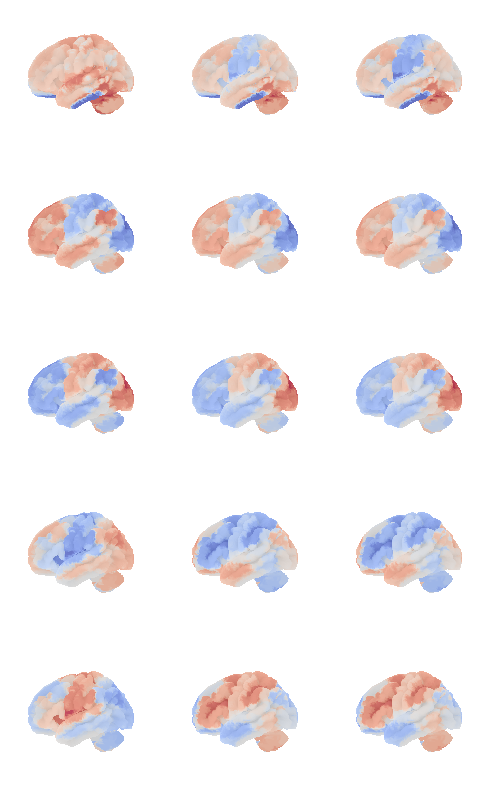
control_signal_analysis(mist_mapper.loc[['PCsul_d', 'l_PCsul', 'R_PCsul'], 'label'].values)[ 93 86 104]
control_signal_analysis(mist_mapper.loc[['MOTnet_vl'], 'label'].values)[84]
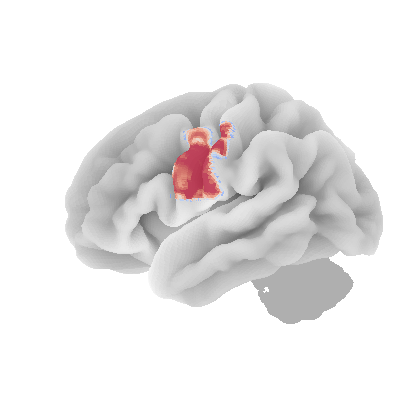
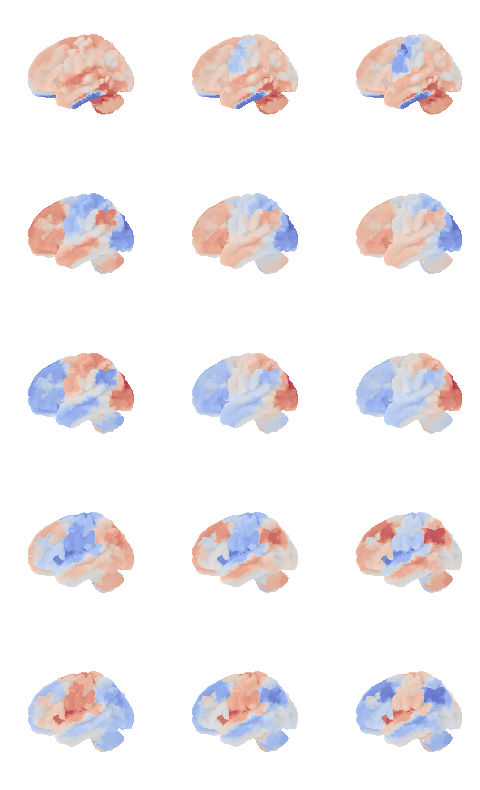
control_signal_analysis(mist_mapper.loc[['L_ANGgyr'], 'label'].values)[21]
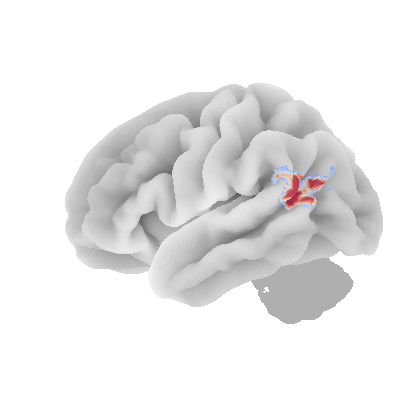
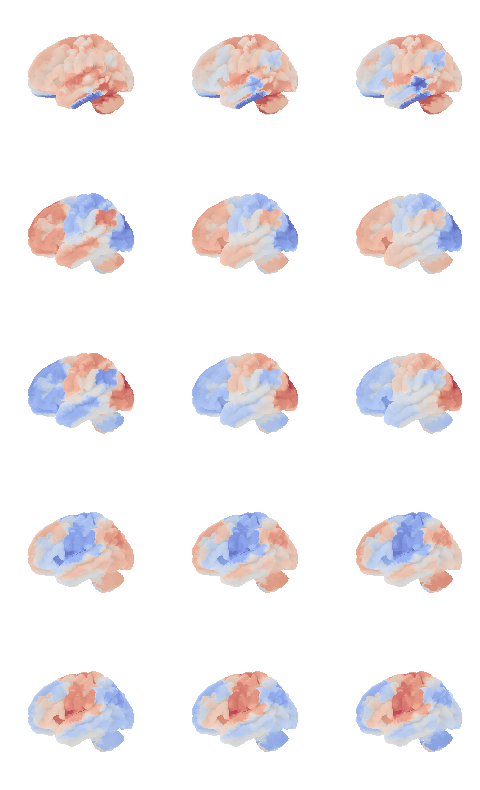
control_signal_analysis(mist_mapper.loc[['PVISnet_vm'], 'label'].values)[118]
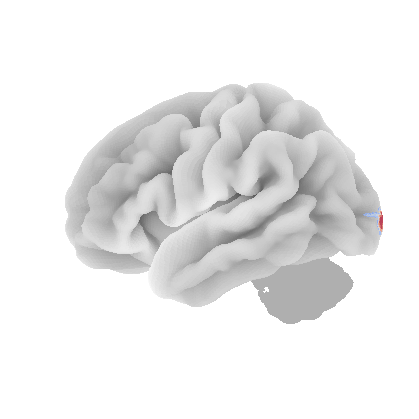
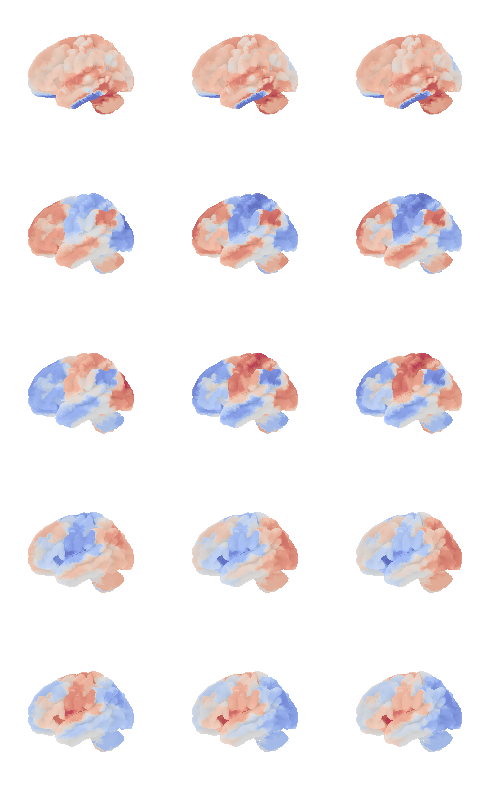
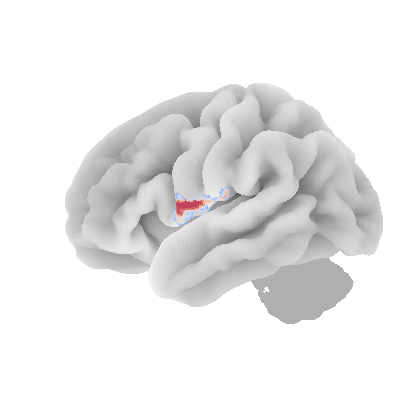
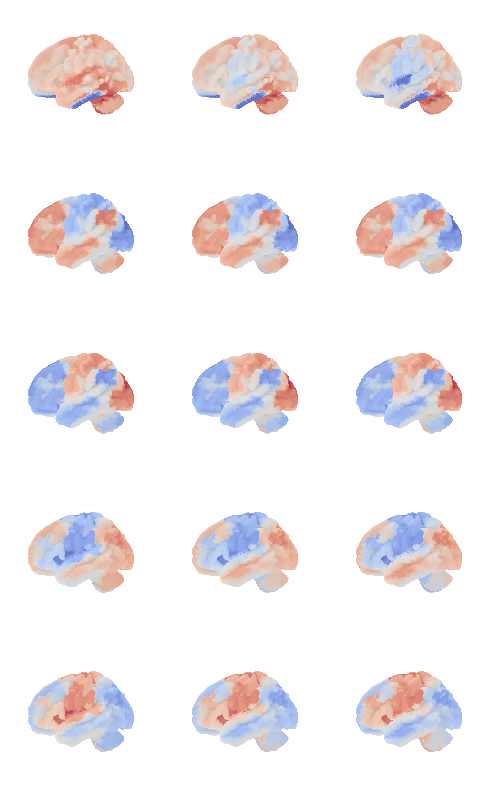
control_signal_analysis(mist_mapper.loc[['PINS_d'], 'label'].values)[105]
Supplementary Information 11
Connections required for a restricted Boltzmann Machine (RBM) with the same number of (hidden) integrator nodes as stored by Hopfield networks with various storage capacities.
correlation_measure = ConnectivityMeasure(kind='precision', vectorize=False, discard_diagonal=False) # uses Ledoit-Wolf estimator
M = correlation_measure.fit_transform(all_ts)
J = -1* correlation_measure.mean_
hopnet = network.Hopfield(J, scale=True)
res = hopnet.update(np.tanh(np.random.normal(0,1,122)), threshold=0, beta=0.06, num_iter=100000)
print(res[1])
network.State(res[0]).plot(plot_abs=False)
741
<nilearn.plotting.displays._projectors.LYRZProjector at 0x348165f70>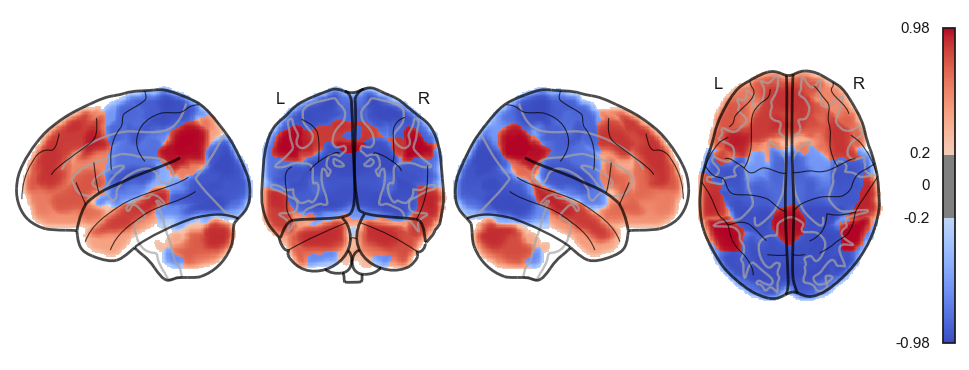
from nilearn import surface, plotting, datasets
fsaverage = datasets.fetch_surf_fsaverage('fsaverage6')
surf = surface.load_surf_mesh('data/full_brain_left.surf.gii')
bg_map = np.hstack((surface.load_surf_data(fsaverage.sulc_left),
                    np.zeros(28935)))

img = network.State(res[0]).to_Nifti1Image()
texture = surface.vol_to_surf(img, surf)
fig = plotting.plot_surf_stat_map(surf, texture, bg_map=bg_map, bg_on_data=True, hemi='left', title='lateral', colorbar=False, cmap='coolwarm', threshold=0)
fig = plotting.plot_surf_stat_map(surf, texture, bg_map=bg_map, bg_on_data=True, hemi='right', title='medial', colorbar=False, cmap='coolwarm', threshold=0)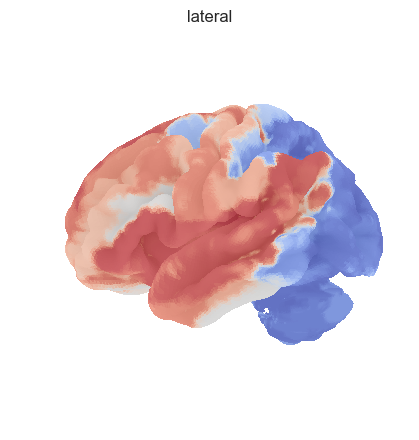
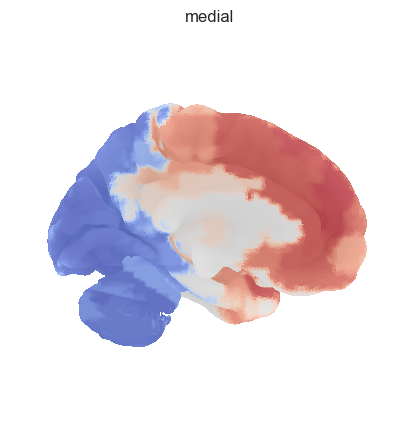
bg_map.shape, surf.coordinates.shape((49419,), (110859, 3))plotting.plot_surf_stat_map(
surf, texture, hemi='left',
title='title', colorbar=True, cmap='coolwarm',
threshold=0)#, bg_map=fsaverage.sulc_left)
from nilearn.image import smooth_img
img = network.State(res[0]).to_Nifti1Image()
# plot surface
from nilearn import plotting
fig, axes = plotting.plot_img_on_surf(img, surf_mesh=s, threshold=0, inflate=False,
                           cmap='coolwarm', bg_on_data=True, alpha=1)
---------------------------------------------------------------------------
ValueError Traceback (most recent call last)
Cell In[113], line 5
3 # plot surface
4 from nilearn import plotting
----> 5 fig, axes = plotting.plot_img_on_surf(img, surf_mesh=s, threshold=0, inflate=False,
6 cmap='coolwarm', bg_on_data=True, alpha=1)
File ~/src/ghost-in-the-machine/venv/lib/python3.9/site-packages/nilearn/plotting/surf_plotting.py:1454, in plot_img_on_surf(stat_map, surf_mesh, mask_img, hemispheres, bg_on_data, inflate, views, output_file, title, colorbar, vmin, vmax, threshold, symmetric_cbar, cmap, cbar_tick_format, **kwargs)
1452 modes = _check_views(views)
1453 hemis = _check_hemispheres(hemispheres)
-> 1454 surf_mesh = check_mesh(surf_mesh)
1456 mesh_prefix = "infl" if inflate else "pial"
1457 surf = {
1458 'left': surf_mesh[f'{mesh_prefix}_left'],
1459 'right': surf_mesh[f'{mesh_prefix}_right'],
1460 }
File ~/src/ghost-in-the-machine/venv/lib/python3.9/site-packages/nilearn/surface/surface.py:1010, in check_mesh(mesh)
1007 missing = {'pial_left', 'pial_right', 'sulc_left', 'sulc_right',
1008 'infl_left', 'infl_right'}.difference(mesh.keys())
1009 if missing:
-> 1010 raise ValueError(
1011 f"{missing} {'are' if len(missing) > 1 else 'is'} "
1012 "missing from the provided mesh dictionary")
1013 return mesh
ValueError: {'pial_left', 'sulc_left', 'pial_right', 'infl_left', 'sulc_right', 'infl_right'} are missing from the provided mesh dictionarynetwork.Hopfield(J).plot_weights()
plt.show()
network.Hopfield(J2).plot_weights()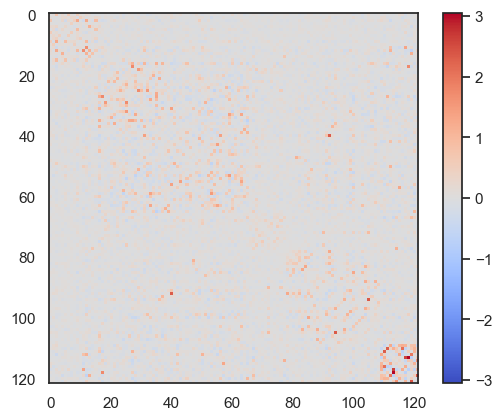
<matplotlib.image.AxesImage at 0x35f3e0910>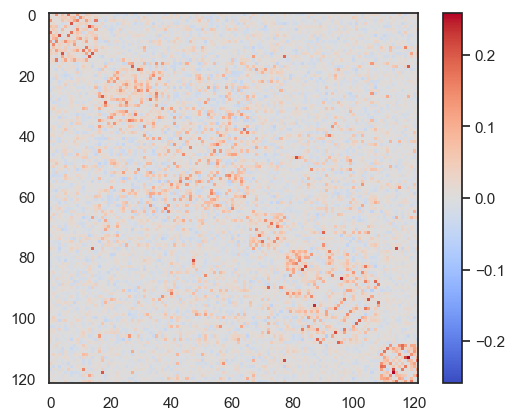
def compute_W_from_J(J, num_attractors=None):
    if num_attractors is None:
        num_attractors = J.shape[0]
    # Eigenvalue decomposition of J
    eigenvalues, eigenvectors = np.linalg.eigh(J)
    # Sort eigenvalues and corresponding eigenvectors in descending order
    idx = np.argsort(eigenvalues)[::-1]
    eigenvalues = eigenvalues[idx]
    eigenvectors = eigenvectors[:, idx]
    # Select the first `num_hidden_nodes` eigenvalues and eigenvectors
    selected_eigenvalues = eigenvalues[:num_attractors]
    selected_eigenvectors = eigenvectors[:, :num_attractors]
    # Compute the weight matrix W
    W = selected_eigenvectors * np.sqrt(-selected_eigenvalues)

    print(np.sqrt(-selected_eigenvalues))
    return W

x =compute_W_from_J(J, 5)
[0.50262855 1.01528971 1.07331623 1.16959446 1.23740527]
- Englert, R., Kincses, B., Kotikalapudi, R., Gallitto, G., Li, J., Hoffschlag, K., Woo, C.-W., Wager, T. D., Timmann, D., Bingel, U., & Spisak, T. (2023). Connectome-Based Attractor Dynamics Underlie Brain Activity in Rest, Task, and Disease. 10.1101/2023.11.03.565516