Supplementary Information
import numpy as np
import seaborn as sns
from matplotlib import pyplot as plt
import scipy.integrate as integrate

sns.set(style="white")
Supplementary Information 1
Python implementation of the continuous Bernoulli distributions: , parametrized by the log odds L and adjusted to the [-1,1] interval.
def CB(x, L, logodds=True):
    if not logodds:
        L=np.log(L/(1-L))
    if np.isclose(L, 0):
        return np.ones_like(x)/2
    else:
        return L * np.exp(L*x) / (2*np.sinh(L))

# Plot some examples
delta = 100
sigma = np.linspace(-1, 1, delta)
for L in np.linspace(-2, 2, 5):
    p_sigma = CB(sigma, L)
    sns.lineplot(x=sigma, y=p_sigma, label=L)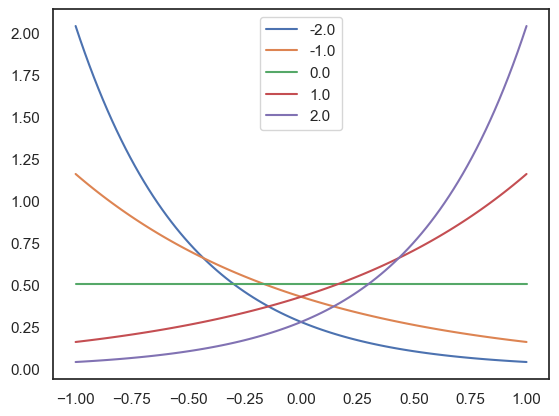
mist_mapper.index.valuesarray(['CER6_p', 'CER7ab', 'R_CERCR2_p', 'CER9_v', 'CER6_a', 'L_CERCR2_a',
'CER9_d', 'CER9_m', 'CER7b_m', 'L_CERCR2_p', 'CER7b_l', 'N',
'CERCR1', 'CER6_d', 'CER5', 'R_CERCR2_a', 'POsul_d', 'POsul_v',
'VMPFcor_p', 'R_MTgyr_a', 'L_ANGgyr', 'L_MTgyr_p', 'L_MTgyr_a',
'DMPFC_ar', 'L_SFsul_a', 'DMPFcor_ac', 'PCcor', 'POsul', 'L_IPlob',
'PGACcor', 'VMPFcor_a', 'PRC_d', 'SFgyr_ad', 'L_IPlob', 'R_ANGgyr',
'PRC_v', 'R_MTgyr_p', 'PRC_d', 'R_MFgyr_a', 'L_DVIS_v', 'SPlob',
'R_VLPFcor', 'FUSgyr_vl', 'R_IFsul', 'FP', 'R_DVIS_v', 'L_FP_l',
'SPlob', 'L_MFgyr_pc', 'L_VLPFcor', 'OCCTgyr_l', 'ACcor_d',
'L_MFgyr_pr', 'R_MFgyr_p', 'R_IPsul', 'L_IFsul', 'DVIS_s',
'FUSgyr_dl', 'R_SFsul', 'R_IPlob', 'R_FP_l', 'R_PORB', 'DMPFcor_p',
'L_IPsul', 'L_MFgyr_a', 'DVIS_vl', 'CAUDNH_NACC', 'COLsul',
'LORBgyr', 'ITgyr', 'STgyr_a', 'MORBgyr', 'PINS_v', 'TP', 'HIPP',
'AMY', 'PIsul', 'CERVM', 'L_MOTnet_dl', 'MOTnet_am', 'R_MOTnet_dl',
'MOTnet_m', 'MOTnet_ml', 'MOTnet_vl', 'MOTnet_l', 'l_PCsul',
'CNGsul_p', 'PUT_p', 'AINS_pd', 'CAUDN_d', 'AINS_v', 'FEF',
'PCsul_d', 'IMsul', 'STgyr_p', 'CAUDN_v', 'PUT_a', 'HSgyr',
'PSMcor_p', 'PSMcor_a', 'SMgyr', 'THAL_d', 'THAL_v', 'R_PCsul',
'PINS_d', 'STgyr_m', 'PCcor', 'AINS_ad', 'CAUDN', 'PVISnet_l',
'MDVISnet_p', 'MDVISnet_a', 'LVISnet_vp', 'MVISnet_p',
'MVISnet_av', 'LVISnet_p', 'PVISnet_dm', 'PVISnet_vm',
'MVISnet_ad', 'VVISnet_l', 'LVISnet_DP', 'VVISnet_m'], dtype=object)mist_mapper.index.valuesarray(['CER6_p', 'CER7ab', 'R_CERCR2_p', 'CER9_v', 'CER6_a', 'L_CERCR2_a',
'CER9_d', 'CER9_m', 'CER7b_m', 'L_CERCR2_p', 'CER7b_l', 'N',
'CERCR1', 'CER6_d', 'CER5', 'R_CERCR2_a', 'POsul_d', 'POsul_v',
'VMPFcor_p', 'R_MTgyr_a', 'L_ANGgyr', 'L_MTgyr_p', 'L_MTgyr_a',
'DMPFC_ar', 'L_SFsul_a', 'DMPFcor_ac', 'PCcor', 'POsul', 'L_IPlob',
'PGACcor', 'VMPFcor_a', 'PRC_d', 'SFgyr_ad', 'L_IPlob', 'R_ANGgyr',
'PRC_v', 'R_MTgyr_p', 'PRC_d', 'R_MFgyr_a', 'L_DVIS_v', 'SPlob',
'R_VLPFcor', 'FUSgyr_vl', 'R_IFsul', 'FP', 'R_DVIS_v', 'L_FP_l',
'SPlob', 'L_MFgyr_pc', 'L_VLPFcor', 'OCCTgyr_l', 'ACcor_d',
'L_MFgyr_pr', 'R_MFgyr_p', 'R_IPsul', 'L_IFsul', 'DVIS_s',
'FUSgyr_dl', 'R_SFsul', 'R_IPlob', 'R_FP_l', 'R_PORB', 'DMPFcor_p',
'L_IPsul', 'L_MFgyr_a', 'DVIS_vl', 'CAUDNH_NACC', 'COLsul',
'LORBgyr', 'ITgyr', 'STgyr_a', 'MORBgyr', 'PINS_v', 'TP', 'HIPP',
'AMY', 'PIsul', 'CERVM', 'L_MOTnet_dl', 'MOTnet_am', 'R_MOTnet_dl',
'MOTnet_m', 'MOTnet_ml', 'MOTnet_vl', 'MOTnet_l', 'l_PCsul',
'CNGsul_p', 'PUT_p', 'AINS_pd', 'CAUDN_d', 'AINS_v', 'FEF',
'PCsul_d', 'IMsul', 'STgyr_p', 'CAUDN_v', 'PUT_a', 'HSgyr',
'PSMcor_p', 'PSMcor_a', 'SMgyr', 'THAL_d', 'THAL_v', 'R_PCsul',
'PINS_d', 'STgyr_m', 'PCcor', 'AINS_ad', 'CAUDN', 'PVISnet_l',
'MDVISnet_p', 'MDVISnet_a', 'LVISnet_vp', 'MVISnet_p',
'MVISnet_av', 'LVISnet_p', 'PVISnet_dm', 'PVISnet_vm',
'MVISnet_ad', 'VVISnet_l', 'LVISnet_DP', 'VVISnet_m'], dtype=object)Supplementary Information 2
Derivation of the exponential form of the continuous Bernoulli distribution, parametrized by the log odds L and adjusted to the [-1,1] interval.
Supplementary Information 3
Visualization of the likelihood function with various parameters, in python.
delta = 100
s_i = np.linspace(-1, 1, delta)

fig, axes = plt.subplots(1, 3, figsize=(12, 3), sharey=True)
for idx, mu in enumerate([0.1, 0.5, 1]):
    for w_i in np.linspace(-2, 2, 5):
            p_mu = CB(s_i, w_i*mu)
            sns.lineplot(x=s_i, y=p_mu, ax=axes[idx], label=w_i).set(title=f"$\mu={mu}$")
bs = np.linspace(-10, 10, 100)
plt.figure(figsize=(4, 1))
sns.lineplot(x=bs, y=1/np.tanh(bs) - 1/bs) # coth(b) - 1/b == 1/2 sech^2(b)
plt.show()
Supplementary Information 5
Note that the last term in the 5th line is a constant with respect to , so we have absorbed it into the normalization constant.
This gives us:
Supplementary Information 6
The explanation from Mehta et al. (2019) for integrating out the integrator nodes of the RBM is
presented here for completeness.
To understand what correlations are captured by , it is helpful to introduce the distribution:
of hidden units , ignoring the interactions between σ and μ , and the cumulant generating function:
is defined such that the -th cumulant is .
The cumulant generating function appears in the marginal free energy of the visible units, which can be rewritten (up to a constant term) as:
We see that the marginal energy includes all orders of interactions between the visible units, with the -th order cumulants of weighting the -th order interactions between the visible units. In the case of the Hopfield model we discussed previously, is a standard Gaussian distribution where the mean is , the variance is , and all higher-order cumulants are zero. Plugging these cumulants the above equation recovers eq. (12).
Supplementary Information 7
From, eq. (12), we get:
If there is no causal relationship between the two features, the integrator node should not be activated, i.e. . In this case, the joint distribution simplifies to:
This shows that in this case the joint distribution of and is independent of any interaction between the two events. Each event contributes separately to the distribution, with no term linking and . Therefore:
Since , we get:
On the other hand, when , we must use the full joint distribution to express P(\sigma_A | \sigma_V, |\mu| > 0):
Here, includes the interaction term involving , which implies a dependency between and . This means:
Given that μ represents the strength of the causal connection, and implies some causality, this distribution will depend on through μ.
import math
from scipy.stats import norm

def E_CB(b):
    return 1/np.tanh(b) - 1/b

def p_mu_given_sigma(mu, sigma_A, sigma_B, beta, w_A, w_B):
    return norm.pdf(mu, loc=w_A*sigma_A + w_B*sigma_B, scale=1/beta)

def E_mu_given_sigma(sigma_A, sigma_B, w_A, w_B):
    return w_A * sigma_A + w_B *sigma_B

def posterior_sigma_given_mu(sigma, mu, b_new, w):
    return CB(sigma, b_new + w * mu)

mu = np.linspace(-2.5, 3, 100)
sigma = np.linspace(-1, 1, 100)
fig, axes = plt.subplots(4, 5, figsize=(8, 3), sharey=False, sharex=False)

beta = 2
w_A = 1
w_B = 1
cases = [(1, 3), (1, 1), (1, -1), (1, -3)]

ymax=4

for i, case in enumerate(cases):
    b_A=case[0]
    b_V=case[1]
    axes[i,0].plot(sigma, CB(sigma, b_A), color='red', linestyle=':')
    axes[i,0].set_ylim([0, ymax])
    axes[i,1].plot(sigma, CB(sigma, b_V), color='blue', linestyle=':')
    axes[i,1].set_ylim([0, ymax])

    axes[i,2].axvline(0, color='gray', linestyle='--', alpha=0.5)
    axes[i,2].plot(mu, p_mu_given_sigma(mu, E_CB(b_A), E_CB(b_V), beta=beta, w_A=w_A, w_B=w_B), color='green')

    axes[i,3].plot(sigma, CB(sigma, b_A), color='red', linestyle=':', alpha=0.5)
    axes[i,4].plot(sigma, CB(sigma, b_V), color='blue', linestyle=':', alpha=0.5)

    axes[i,3].plot(sigma, posterior_sigma_given_mu(sigma, E_mu_given_sigma(E_CB(b_A), E_CB(b_V), w_A=w_A, w_B=w_B), b_A, w_A), color='red' )
    axes[i,3].set_ylim([0, ymax])
    axes[i,4].plot(sigma, posterior_sigma_given_mu(sigma, E_mu_given_sigma(E_CB(b_V), E_CB(b_A), w_A=w_B, w_B=w_A), b_V, w_B), color='blue' )
    axes[i,4].set_ylim([0, ymax])

    if i<len(cases)-1:
        for ax in axes[i,:]:
            ax.xaxis.set_ticks([])
# erase y axis ticks
for ax in axes.flatten():
    ax.yaxis.set_ticks([])
# despine
sns.despine()
# text label 'foo'
fig.text(0.1, 0.75, 'Strong evidence\n$\mu \gg 0$', ha='right')
fig.text(0.1, 0.55, 'Weak evidence\n$\mu > 0$', ha='right')
fig.text(0.1, 0.35, 'No evidence\n$\mu ≈ 0$', ha='right')
fig.text(0.1, 0.15, 'Contradictory evidence\n$\mu < 0$', ha='right')

fig.text(0.28, 0.95, 'Prior', ha='center')
fig.text(0.51, 0.95, 'Integrator', ha='center')
fig.text(0.76, 0.95, 'Posterior', ha='center')

fig.text(0.2, -0.04, '$\sigma_A$', ha='center', fontdict={'size': 12})
fig.text(0.36, -0.04, '$\sigma_V$', ha='center', fontdict={'size': 12})
fig.text(0.52, -0.04, '$\mu | \sigma_A, \sigma_V$', ha='center', fontdict={'size': 12})
fig.text(0.68, -0.04, '$\sigma_A | \mu, \sigma_V$', ha='center', fontdict={'size': 12})
fig.text(0.84, -0.04, '$\sigma_V | \mu, \sigma_A$', ha='center', fontdict={'size': 12})
plt.show()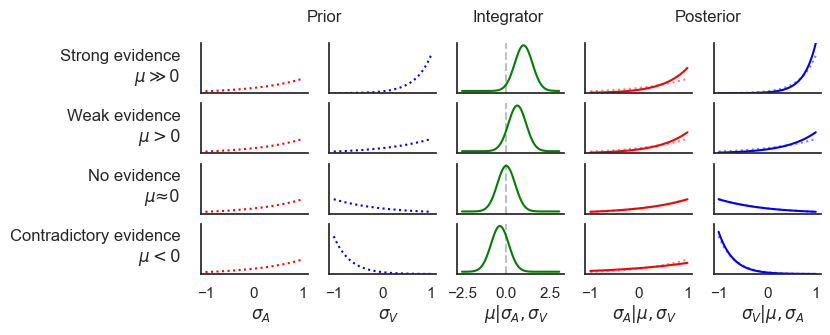
Supplementary Information 8
import math
def E_mu_given_sigma_neg(sigma_A, sigma_B, w_A, w_B):
    return -1*E_mu_given_sigma(sigma_A, sigma_B, w_A, w_B)  # inhibitory activation
# equivalent implementations:
# - to set a|mu to a Dirac delta shifted into the negative direction: a | mu ~ delta(-w mu)
# - to set sigma|a to CB(b-a)
# neural interpretation 1: this constructs the difference between the prediction mu and the sensory evidence sigma
# neural interpretation 2: the lower level-regions receive inhibitory input from the higher level

mu = np.linspace(-2.5, 2.5, 100)
sigma = np.linspace(-1, 1, 100)
fig, axes = plt.subplots(3, 5, figsize=(8, 3), sharey=False, sharex=False)

beta = 2
w_A = 1
w_B = -1
cases = [(0.001, 3), (3, 0.001),(2,2)]
ymax=3

for i, case in enumerate(cases):

    b_A=case[0]
    b_V=case[1]
    axes[i,0].plot(sigma, CB(sigma, b_A), color='red', linestyle=':')
    axes[i,0].set_ylim([0, ymax])
    axes[i,1].plot(sigma, CB(sigma, b_V), color='blue', linestyle=':')
    axes[i,1].set_ylim([0, ymax])

    axes[i,2].axvline(0, color='gray', linestyle='--', alpha=0.5)
    axes[i,2].plot(mu, p_mu_given_sigma(mu, E_CB(b_A), E_CB(b_V), beta=beta, w_A=w_A, w_B=w_B), color='green')

    axes[i,3].plot(sigma, CB(sigma, b_A), color='red', linestyle=':', alpha=0.5)
    axes[i,4].plot(sigma, CB(sigma, b_V), color='blue', linestyle=':', alpha=0.5)

    axes[i,3].plot(sigma, posterior_sigma_given_mu(sigma, mu=E_mu_given_sigma_neg(E_CB(b_A), E_CB(b_V), w_A=w_A, w_B=w_B), b_new=b_A, w=w_A), color='red' )
    axes[i,3].set_ylim([0, ymax])
    axes[i,4].plot(sigma, posterior_sigma_given_mu(sigma, mu=E_mu_given_sigma_neg(E_CB(b_V), E_CB(b_A), w_A=w_B, w_B=w_A), b_new=b_V, w=w_B), color='blue' )
    axes[i,4].set_ylim([0, ymax])

    if i<len(cases)-1:
        for ax in axes[i,:]:
            ax.xaxis.set_ticks([])

for ax in axes.flatten():
    ax.yaxis.set_ticks([])
sns.despine()
fig.text(0.1, 0.7, 'Too low\n$\mu < 0$', ha='right')
fig.text(0.1, 0.45, 'Too high\n$\mu > 0$', ha='right')
fig.text(0.1, 0.18, 'Accurate\n$\mu ≈ 0$', ha='right')

fig.text(0.2, 0.95, 'Prediction $t_0$', ha='center', fontdict={'size': 9})
fig.text(0.36, 0.95, 'Sensory evidence $t_0$', ha='center', fontdict={'size': 9})
fig.text(0.52, 0.95, 'Prediction error', ha='center', fontdict={'size': 9})
fig.text(0.68, 0.95, 'Prediction $t_1$', ha='center', fontdict={'size': 9})
fig.text(0.84, 0.95, 'Sensory evidence $t_1$', ha='center', fontdict={'size': 9})

fig.text(0.2, -0.04, '$\sigma_P$', ha='center', fontdict={'size': 12})
fig.text(0.36, -0.04, '$\sigma_O$', ha='center', fontdict={'size': 12})
fig.text(0.52, -0.04, '$\mu | \sigma_P, \sigma_O$', ha='center', fontdict={'size': 12})
fig.text(0.68, -0.04, '$\sigma_P | \mu, \sigma_O$', ha='center', fontdict={'size': 12})
fig.text(0.84, -0.04, '$\sigma_O | \mu, \sigma_P$', ha='center', fontdict={'size': 12})
plt.show()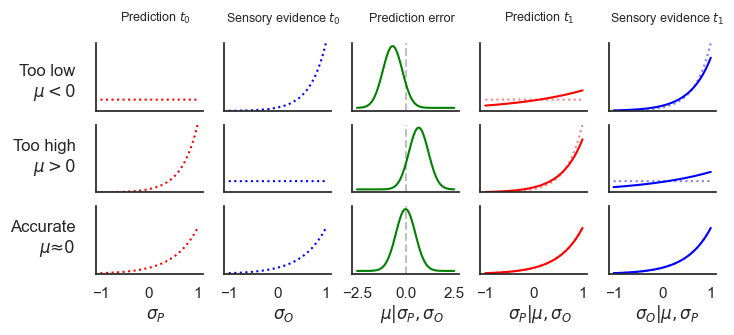
def E_posterior_sigma_given_mu(mu, b_new, w):
    return E_CB(b_new + w * mu)

bas = np.linspace(-1, 1, 100)
bvs = np.linspace(-10, 10, 100)
# create a heatmap
heatmap = np.zeros((100, 100))
for i, ba in enumerate(bas):
    for j, bv in enumerate(bvs):
        heatmap[i, j] = E_posterior_sigma_given_mu(E_mu_given_sigma(E_CB(ba), E_CB(bv), 1, 1 ), ba, 1)
sns.heatmap(heatmap, cmap='coolwarm')
<Axes: >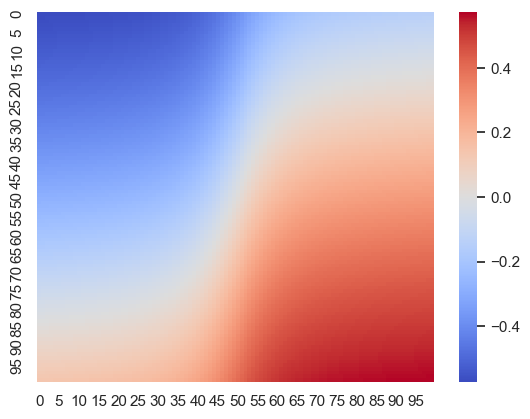
Supplementary Information 9
We start from the energy of the Hopfield network e.q (16), written in the matrix notation:
To complete the square, we added and subtracted within the exponent.
We recognize that . Now add and subtract
Given that , the expression simplifies to:
Note, that the term is independent of σ, we have absorbed it into the normalization constant.
This is exactly the exponent of a multivariate Gaussian distribution with mean and covariance matrix , meaning that the weight matrix of the attractor network can be reconstructed as the inverse covariance matrix of activation timeseries of the lower-level nodes:
Supplementary Information 10
To derive the weights belonging to the attractor states from , first we write e.q. (17) in the matrix notation:
\
The factorization is not unique. For any orthogonal matrix (i.e., ), the matrix also satisfies . This means there are infinitely many possible choices for corresponding to the same , and they are related by an orthogonal transformation.
Given , a possible can be found using eigenvalue decomposition:
Where is an orthogonal matrix whose columns are the eigenvectors of and Λ is an diagonal matrix with the eigenvalues of on the diagonal.
Since , we can rewrite it as:
From this, we can express as:
Up to the orthogonal transformation .
If we further assume that has orthogonal columns (i.e. the RBM is non-redundant), then is the identity matrix and we have:
Or, in the component form:
where is the -th component of the -th eigenvector, and is the -th eigenvalue of the matrix .
Note that, in this case, the corresponding Hopfield networks is a projection network Personnaz et al., 1985Kanter & Sompolinsky, 1987, a form of Hopfield networks that provides highly stable attractors and increased storage capacity by orthogonalizing the patterns to be stored.
Supplementary Information 11
Connections required for a restricted Boltzmann Machine (RBM) with the same number of (hidden) integrator nodes as stored by Hopfield networks with various storage capacities.
n_attractors = np.linspace(4, 1000, 1000).astype(int)
cost_RBM = n_attractors * n_attractors
cost_HN = n_attractors * (n_attractors - 1) / 2 #saturating the max capacity
cost_mHN = np.log2(n_attractors)

fig, axes = plt.subplots(1, 2, figsize=(8, 1.7), sharey=False, sharex=False)

axes[0].plot(cost_RBM, n_attractors, label="RBM", linestyle='-')
axes[0].plot(cost_HN, n_attractors, label="HN", linestyle='--')
axes[0].set(ylabel='# attractors')
axes[0].set(xlabel='wiring cost (# connections)')
#axes[0].set(xscale='log')
axes[0].set(yscale='log')
axes[0].set_xlim([5, 2000])
axes[0].set_ylim([5, 100])
axes[0].legend()

n_attractors = np.linspace(2, 100000000, 1000).astype(int)
cost_RBM = n_attractors * n_attractors
cost_HN = n_attractors * (n_attractors - 1) / 2 #saturating the max capacity
cost_mHN = np.log2(n_attractors)

axes[1].plot(cost_RBM, n_attractors, label="RBM", linestyle='-')
axes[1].plot(cost_HN, n_attractors, label="HN", linestyle='--')
axes[1].plot(cost_mHN, n_attractors, label="mHN", linestyle=':')
axes[1].set(ylabel='')
axes[1].set(xlabel='wiring cost (#connections)')
#axes[1].set(xscale='log')
axes[1].set(yscale='log')
# set y limit
axes[1].set_xlim([0, 31])
axes[1].set_ylim([1, 100000000])
axes[1].legend()
axes[1].legend(fontsize='small')
sns.despine()
plt.show()
import numpy as np
import matplotlib.pyplot as plt

def kl_divergence(b_q, b_p):
    with np.errstate(divide='ignore', invalid='ignore'):
        return (b_q - b_p) * (1 / np.tanh(b_q) - 1/b_q) + np.log((b_q * np.sinh(b_p)) / (b_p * np.sinh(b_q)))

b_q_values = np.linspace(-5, 5, 100)
b_p_values = np.linspace(-5, 5, 100)
kl_values = np.zeros((len(b_q_values), len(b_p_values)))
for i, b_q in enumerate(b_q_values):
    for j, b_p in enumerate(b_p_values):
        kl_values[i, j] = kl_divergence(b_q, b_p)

plt.figure(figsize=(10, 8))
plt.imshow(kl_values, cmap='viridis', origin='lower', aspect='auto', extent=[b_p_values.min(), b_p_values.max(), b_q_values.min(), b_q_values.max()])
plt.colorbar(label='KL Divergence')
plt.xlabel('b_p')
plt.ylabel('b_q')
plt.title('KL Divergence for Continuous Bernoulli Distributions')
plt.show()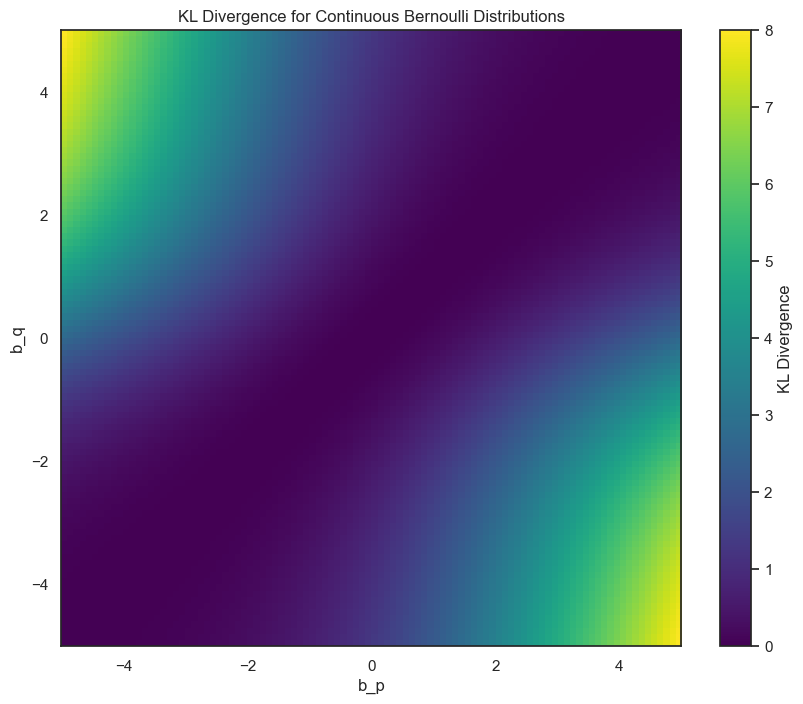
- Mehta, P., Bukov, M., Wang, C.-H., Day, A. G. R., Richardson, C., Fisher, C. K., & Schwab, D. J. (2019). A high-bias, low-variance introduction to Machine Learning for physicists. Physics Reports, 810, 1–124. 10.1016/j.physrep.2019.03.001
- Personnaz, L., Guyon, I., & Dreyfus, G. (1985). Information storage and retrieval in spin-glass like neural networks. Journal de Physique Lettres, 46(8), 359–365. 10.1051/jphyslet:01985004608035900
- Kanter, I., & Sompolinsky, H. (1987). Associative recall of memory without errors. Physical Review A, 35(1), 380–392. 10.1103/physreva.35.380